
Group financial review
Revenue and results for the fourth quarter 2025Comparable figures for Q4 2024 in brackets
Farming Norway
| (in NOK thousand) | Q4 2025 | Q4 2024 | 2025 | 2024 |
|---|---|---|---|---|
| Operating revenue | 98 739 | 148 687 | 325 250 | 467 742 |
| Operational EBITDA2 | -1 304 | 15 325 | -39 483 | 112 425 |
| Operational EBIT2 | -17 434 | -3 882 | -116 399 | 37 884 |
| All-in price realization/kg (NOK)1 | 74 | 82 | 69 | 93 |
| Harvest volumes (tonnes, HOG) | 1 203 | 1 729 | 4 403 | 4 891 |
| Farming EBITDA cost/kg | 72,6 | 70,9 | 77,1 | 67,8 |
| Operational EBITDA/kg (NOK) | -1,1 | 8,9 | -9,0 | 23,0 |
| Operational EBIT/kg (NOK) | -14,5 | -2,2 | -26,4 | 7,7 |
| 1 Calculated on a back to farm basis and adjusted for transport cost to Norway border (Sisalmoni equivalent) | ||||
| 2 Before fair value adjustment related to biological assets | ||||
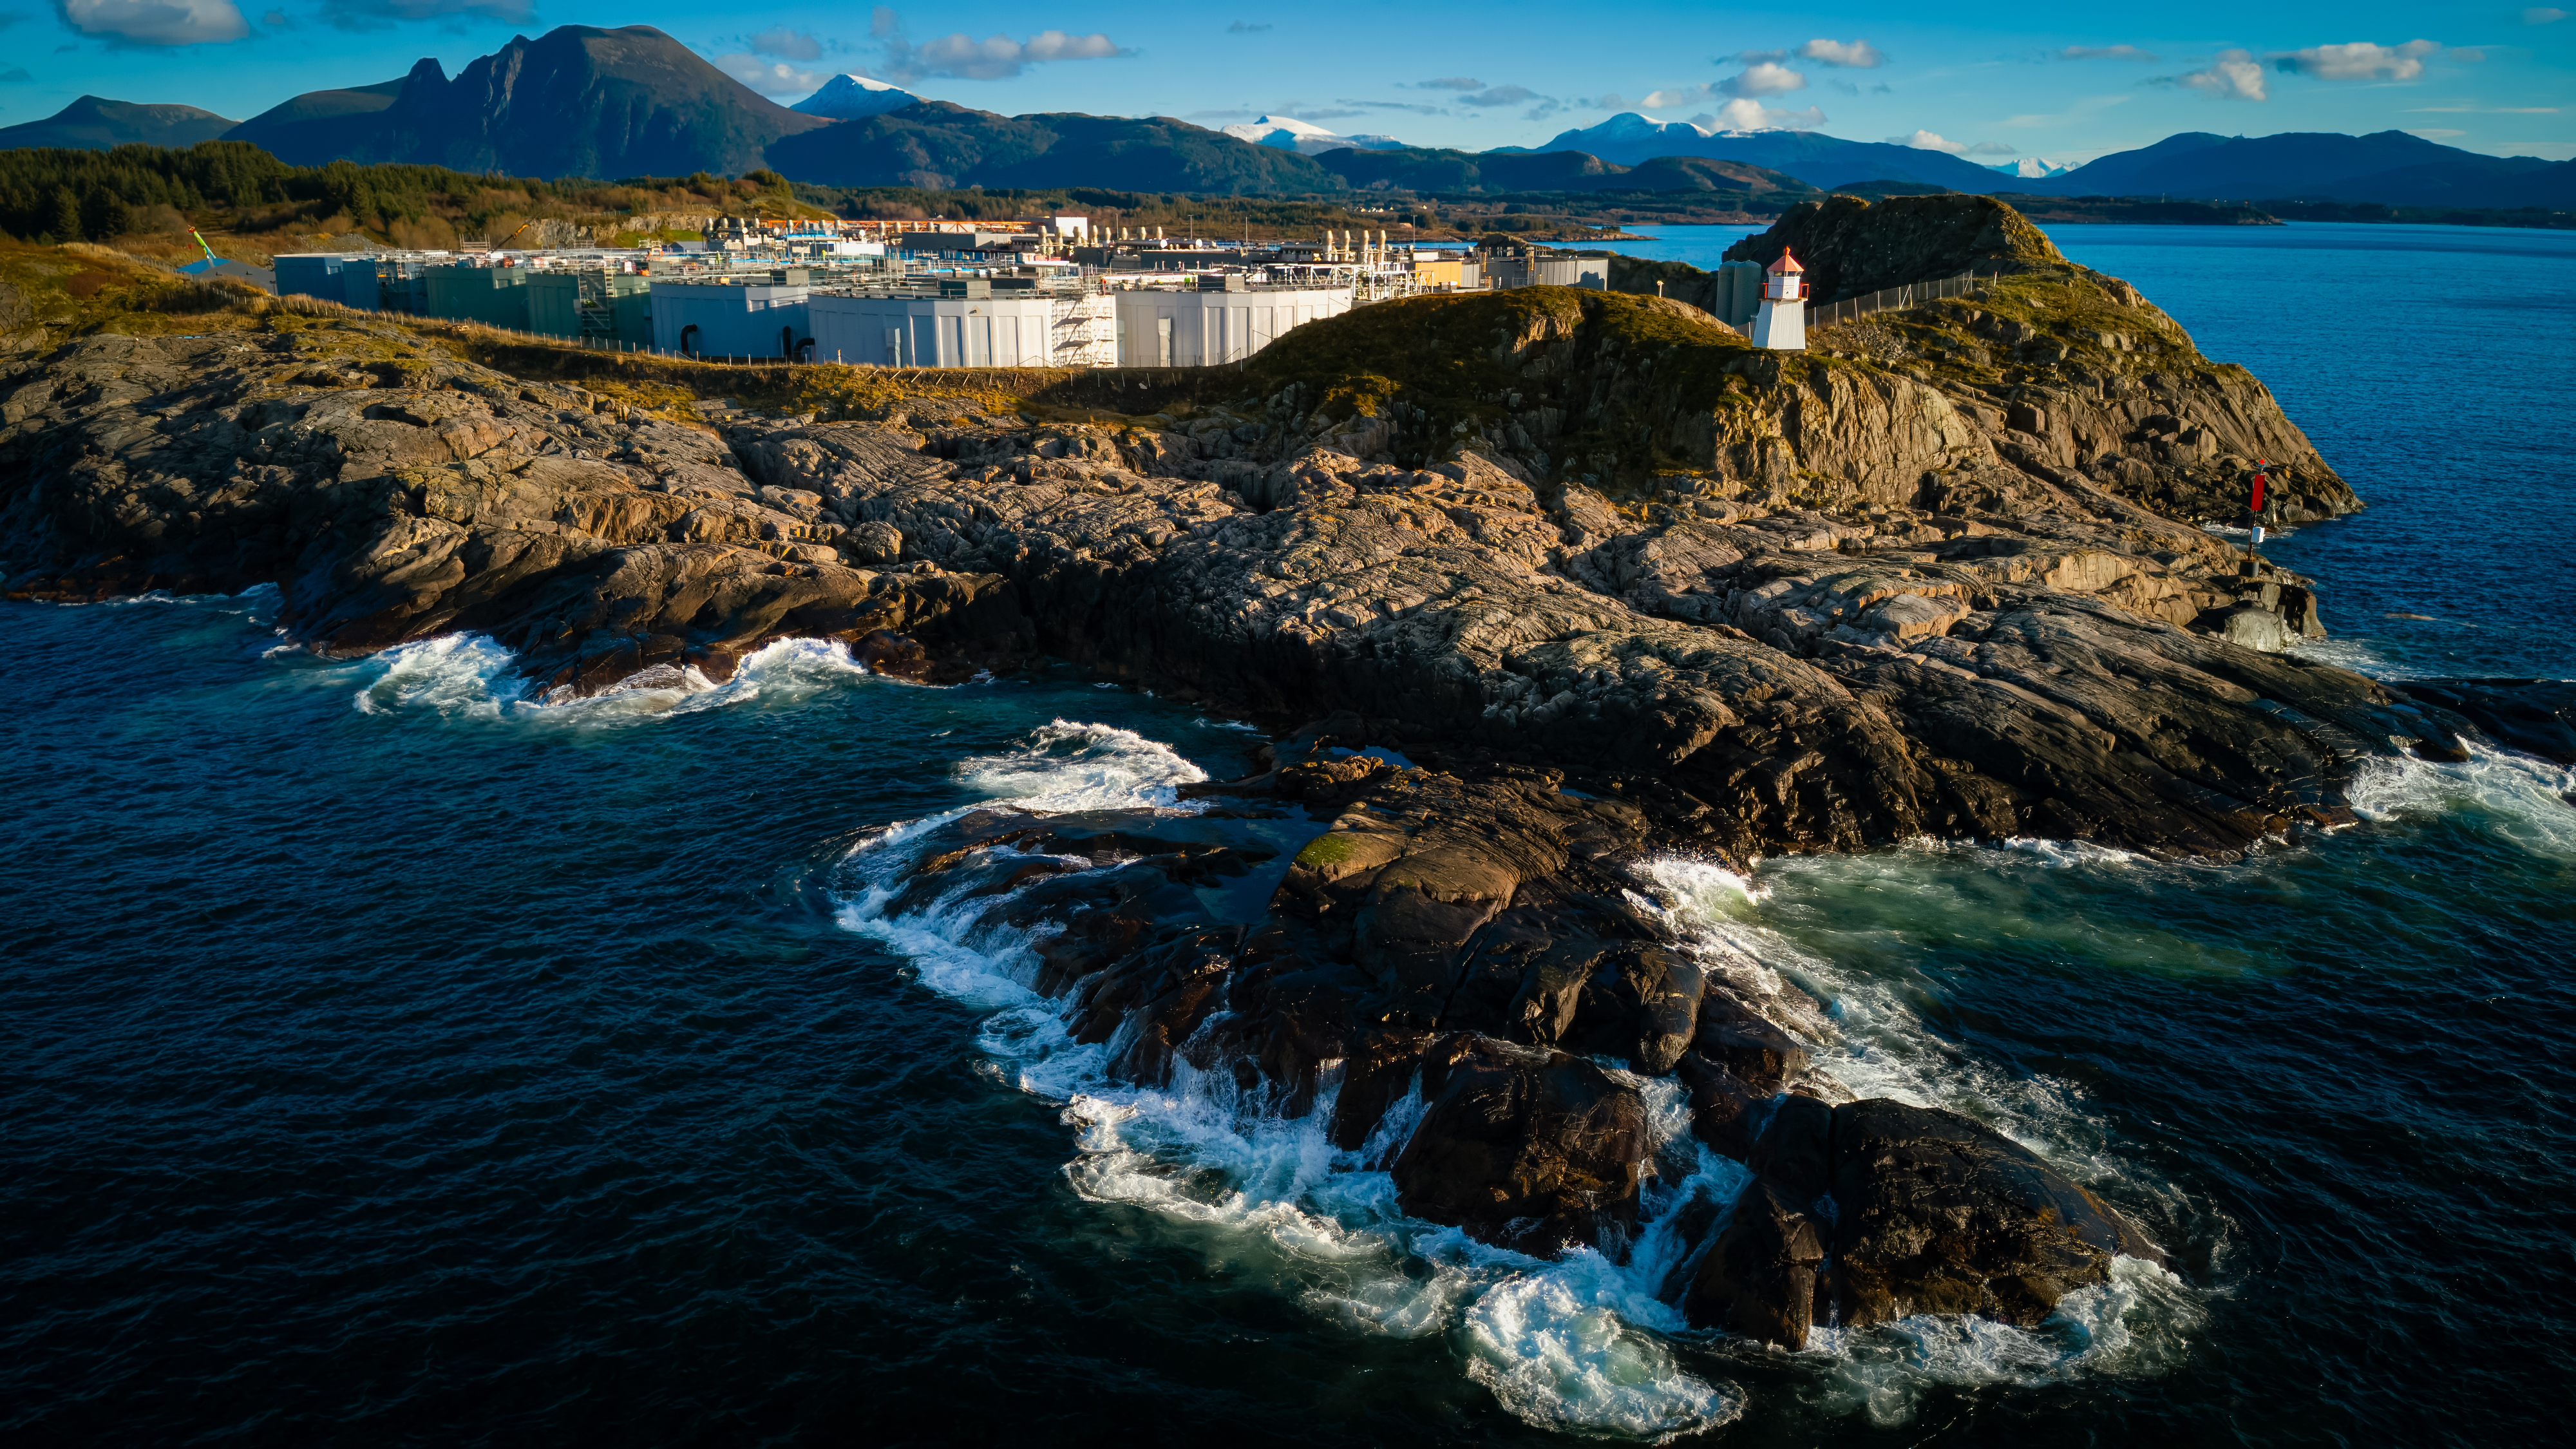
Farming Norway consists of the farming activities at the grow-out facility at Indre Harøy, smolt production at Salmon Evolution Dale and sales.
Salmon Evolution harvested 1,203 tonnes HOG in the quarter, with average harvest weights and superior grade share in line with Q3-25. This generated revenues of 98.7 NOKm (148.7 NOKm) reflecting the relatively weak salmon prices in the quarter, with average realized prices of 74 NOK/kg, down 10 % y/y. The all-in price realization reflects that harvest took place in October and November.
Due to overcapacity, Salmon Evolution sold a smolt Company during the quarter to a well-renowned sea-based farmer, generating revenues of 8.4m.
Operating expenses ended at 100.0 NOKm (133,4 NOKm), reflecting a 30 % lower harvest volume compared to the same quarter last year. The Company has started to take some costs in relation to the preparation and testing of the Indre Harøy phase 2 expansion. In relation to this the company has recorded capacity adjustments of 1.2 NOKm in Q4-25.
Farming EBITDA cost/kg ended at 72.6 NOK/kg in Q4-25, a significant improvement from Q3-25 where a ~8 % negative harvest deviation materially impacted costs.
Operational EBITDA in the Farming segment ended at -1.3 NOKm (15.3 NOKm), reflecting a lower harvest volume and weaker prices compared to the corresponding period last year. Adjusted for ramp-up costs in relation to phase 2 farming operations where breakeven in Q4.
Depreciations in Q4-25 ended at 16.1 NOKm, down 4.0 NOKm compared to the previous quarter. The reason for the decrease in depreciations is an update in the useful life estimates certain equipment at the Dale smolt facility. This update has been retroactively applied for 2025, normalized depreciations in Q4-25 excluding this one-off implementation effect of 3.8 NOKm were 19.9 NOKm.
Operational EBIT for Q4-25 ended at -17.4 NOKm including the above mentioned effect on depreciations.
Other
| (in NOK thousand) | Q4 2025 | Q4 2024 | 2025 | 2024 |
|---|---|---|---|---|
| Operating revenue | 11 578 | 8 501 | 34 272 | 28 160 |
| Operational EBITDA | -7 127 | -6 077 | -39 203 | -41 010 |
In the Other segment all the resources related to projects and technology are employed, as well as general corporate functions. A significant portion of costs are related to future expansion.
In Q4-25 the Other segment recorded operating revenues of 11.6 NOKm (8.5 NOKm). Revenues in this segment are in all material respect related to sale of services to the Farming segment and growth projects – primarily the Indre Harøy phase 2 expansion.
The cost base in the segment is primarily salaries, representing around 65 % of operating costs. A portion of this is reinvoiced to the Farming segment for services rendered, as well as salaries relating to personnel taking part in the Indre Harøy phase 2 expansion project. The increase in revenues for the segment compared to previous quarters reflects an intensification of activities as phase 2 has entered testing and commissioning in preparation for the first smolt insert.
Operating expenses totaled 18.6 NOKm (14,5 NOKm), in line with the 2025 run-rate. Cash burn on growth projects outside phase 2 at Indre Harøy has been reduced to a minimum. Compared to 2024 underlying spend including capitalized costs has been significantly reduced, reflecting the strategic focus on phase 1 operations and phase 2 project execution.
The operational EBITDA ended at -7.1 NOKm (-6.1 NOKm).
Group
| (in NOK thousand) | Q4 2025 | Q4 2024 | 2025 | 2024 |
|---|---|---|---|---|
| Total operating revenue and other income | 98 739 | 149 535 | 326 022 | 471 573 |
| Operational EBITDA2 | -8 431 | 9 248 | -78 686 | 71 415 |
| Operational EBIT | -25 177 | -11 291 | -158 906 | -4 727 |
| Fair value adjustment of biomass | 18 211 | -10 493 | 15 630 | -10 498 |
| Operating Profit (EBIT) | -6 966 | -21 784 | -143 276 | -15 225 |
| Net financial | 8 113 | -5 141 | -28 324 | -32 180 |
| Profit (loss) before tax | 1 147 | -26 925 | -171 601 | -47 405 |
| 2 Before fair value adjustment related to biological assets | ||||
The Company is the consolidated accounts of Salmon Evolution and consists of the Farming and Other segment.
Company revenues amounted to 98.7 NOKm (149.5 NOKm) in Q4-25, all related to sales of head-on gutted salmon and a smolt group.
Operating expenses totalled 107.1 NOKm (140.3 NOKm), reflecting a 30 % lower harvest volume compared to the same quarter last year. Operating expenses for the Company are in all material respect related to the Dale smolt facility and Indre Harøy grow-out facility, and other administrative expenses.
Operational EBITDA in the quarter ended at -8.4 NOKm (9.2 NOKm), reflecting a lower harvest volume and weaker prices compared to the corresponding period last year. Additionally, Salmon Evolution has taken some ramp-up costs related to phase 2 directly in the PL.
Depreciations in Q4-25 ended at 16.7 NOKm, down 4.2 NOKm compared to the previous quarter. The reason for the decrease in depreciations is an update in the useful life estimates certain equipment at the Dale smolt facility. This update has been retroactively applied for 2025, normalized depreciations in Q4-25 excluding this one-off implementation effect of 3.8 NOKm were 20.5 NOKm in the quarter.
The fair value adjustment amounted to 18.2 NOKm, driven by an increase in forward prices during the quarter. This left the operating loss at 7.0 NOKm.
Net financials for the quarter were positive at 8.1 NOKm (-5.1 NOKm). In the quarter the Company has reassessed its application of IAS 23 Borrowing cost and its effect on capitalization of borrowing cost related to financing of Indre Harøy with retroactive application for 2025, leading to more of the Companys interest cost being capitalized on the ongoing phase 2 expansion. See note 5 for further information.
The Company recorded no tax cost either in Q4-25, nor in 2025. For the period the result ended at 1.1 NOKm (negative 26.9 NOKm).
Salmon Evolution’s share of K Smart’s net income is recognized in the profit and loss statement. The investment in K Smart is accounted for by using the equity method where K Smart is considered an associated company.
Cash flow
| (in NOK thousand) | Q4 2025 | Q4 2024 | 2025 | 2024 |
|---|---|---|---|---|
| Net cash flow from operating activities | 18 746 | 965 | -59 052 | 43 331 |
| Net cash flow from investments activities | -386 911 | -155 496 | -1 252 431 | -342 562 |
| Net cash flow from financing activities | 375 247 | 20 742 | 1 045 458 | 342 297 |
| Net change in cash and cash equivalents | 7 083 | -133 789 | -266 024 | 43 066 |
| Cash and cash equivalents at start of period | 156 354 | 563 251 | 429 462 | 386 396 |
| Cash and cash equivalents at end of period | 163 437 | 429 462 | 163 438 | 429 462 |
In Q4 the Company had net cash flow from operating activities of 18.7 NOKm (1.0 NOKm), primarily an effect of reduced working capital in the period. Inventories and biological assets, adjusted for fair value, were slightly up from last quarter.
Investments in the quarter, was in all material aspects related to the Indre Harøy phase 2 expansion project. The net cash flow from investment activities in the quarter ended at - 386.9 NOKm (-155.5 NOKm).
Cash flow from financing ended at 375.2 NOKm (positive 20.7 NOKm), primarily related to drawdowns on the construction financing net of interest paid in the period.
Total change in cash and cash equivalents in the quarter ended at 7.1 NOKm (-133.8 NOKm). Cash and cash equivalents ended at 163.4 NOKm excluding amounts available under the existing bank facilities.
Financial position
| (in NOK thousand) | 31 Des 2025 | 31 Des 2024 |
|---|---|---|
| Non-current assets | 3 736 330 | 2 415 709 |
| Current assets | 479 276 | 768 639 |
| Total assets | 4 215 607 | 3 184 348 |
| Equity | 2 062 673 | 2 223 260 |
| Non-current liabilities | 1 578 959 | 582 411 |
| Current liabilities | 573 975 | 378 677 |
| Total equity and liabilties | 4 215 607 | 3 184 348 |
On 31 December 2025 the book value of the Company’s assets was 4,215.6 NOKm (3,184.3 NOKm). The increase from previous periods is primarily related to the ongoing Indre Harøy phase 2 expansion project.
The fixed assets in the Company mostly relate to the facility at Indre Harøy, comprising land, buildings, and production equipment, as well as the Dale smolt facility and other smaller items. There are no significant movements from the previous quarter, apart from the increase in fixed assets related to the Indre Harøy phase 2 project.
Current assets in the Company are primarily biological assets, receivables, and cash & cash equivalents.
Total equity amounted to 2,062.7 NOKm which corresponds to an equity ratio of 49%.
Consolidated net interest-bearing debt totalled 1,757.4 NOKm at the end of the quarter. The short-term interest-bearing debt is primarily related to working capital financing at Indre Harøy and Dale and the new 250 NOKm financing facility announced in June 2025.
Share information
As per 31 December 2025 DNB Asset Management was the Company’s largest shareholder with 33,313,268 shares through various funds, corresponding to 7.2% of the total number of shares outstanding. The 20 largest shareholders held 57.7% of the shares in the Company.
During the quarter the average daily traded volume was about 762,000 shares and the average daily traded value was about NOK 3.9 million (Oslo Børs).
Salmon Evolution ASA was listed on Oslo Børs on 9 July 2021.
Source: Monitor Holdings, Company