
Group financial review
Revenue and results for the third quarter 2026Comparable figures for Q3 2025 in brackets
Farming Norway
| (in NOK thousand) | Q3 2026 | Q3 2025 | YTD 2026 | YTD 2025 | 2025 |
|---|---|---|---|---|---|
| Operating revenue | 104 782 | 86 599 | 323 636 | 226 511 | 325 250 |
| Operational EBITDA2 | -13 294 | -30 592 | 1 309 | -38 177 | -39 483 |
| Operational EBIT2 | -33 585 | -51 000 | -58 893 | -98 963 | -116 399 |
| All-in price realization/kg (NOK)1 | 64,3 | 61,1 | 73,6 | 67,8 | 69,5 |
| Harvest volumes (tonnes, HOG) | 1 597 | 1 387 | 4 306 | 3 201 | 4 403 |
| Farming EBITDA cost/kg | 71,3 | 81,8 | 71,7 | 80,3 | 77,1 |
| Operational EBITDA/kg (NOK) | -8,3 | -22,1 | 0,3 | -11,9 | -9,0 |
| Operational EBIT/kg (NOK) | -21,0 | -36,8 | -13,7 | -30,9 | -26,4 |
| 1 Calculated on a back to farm basis and adjusted for transport cost to Norway border (Sisalmoni equivalent) | |||||
| 2 Before fair value adjustment related to biological assets | |||||
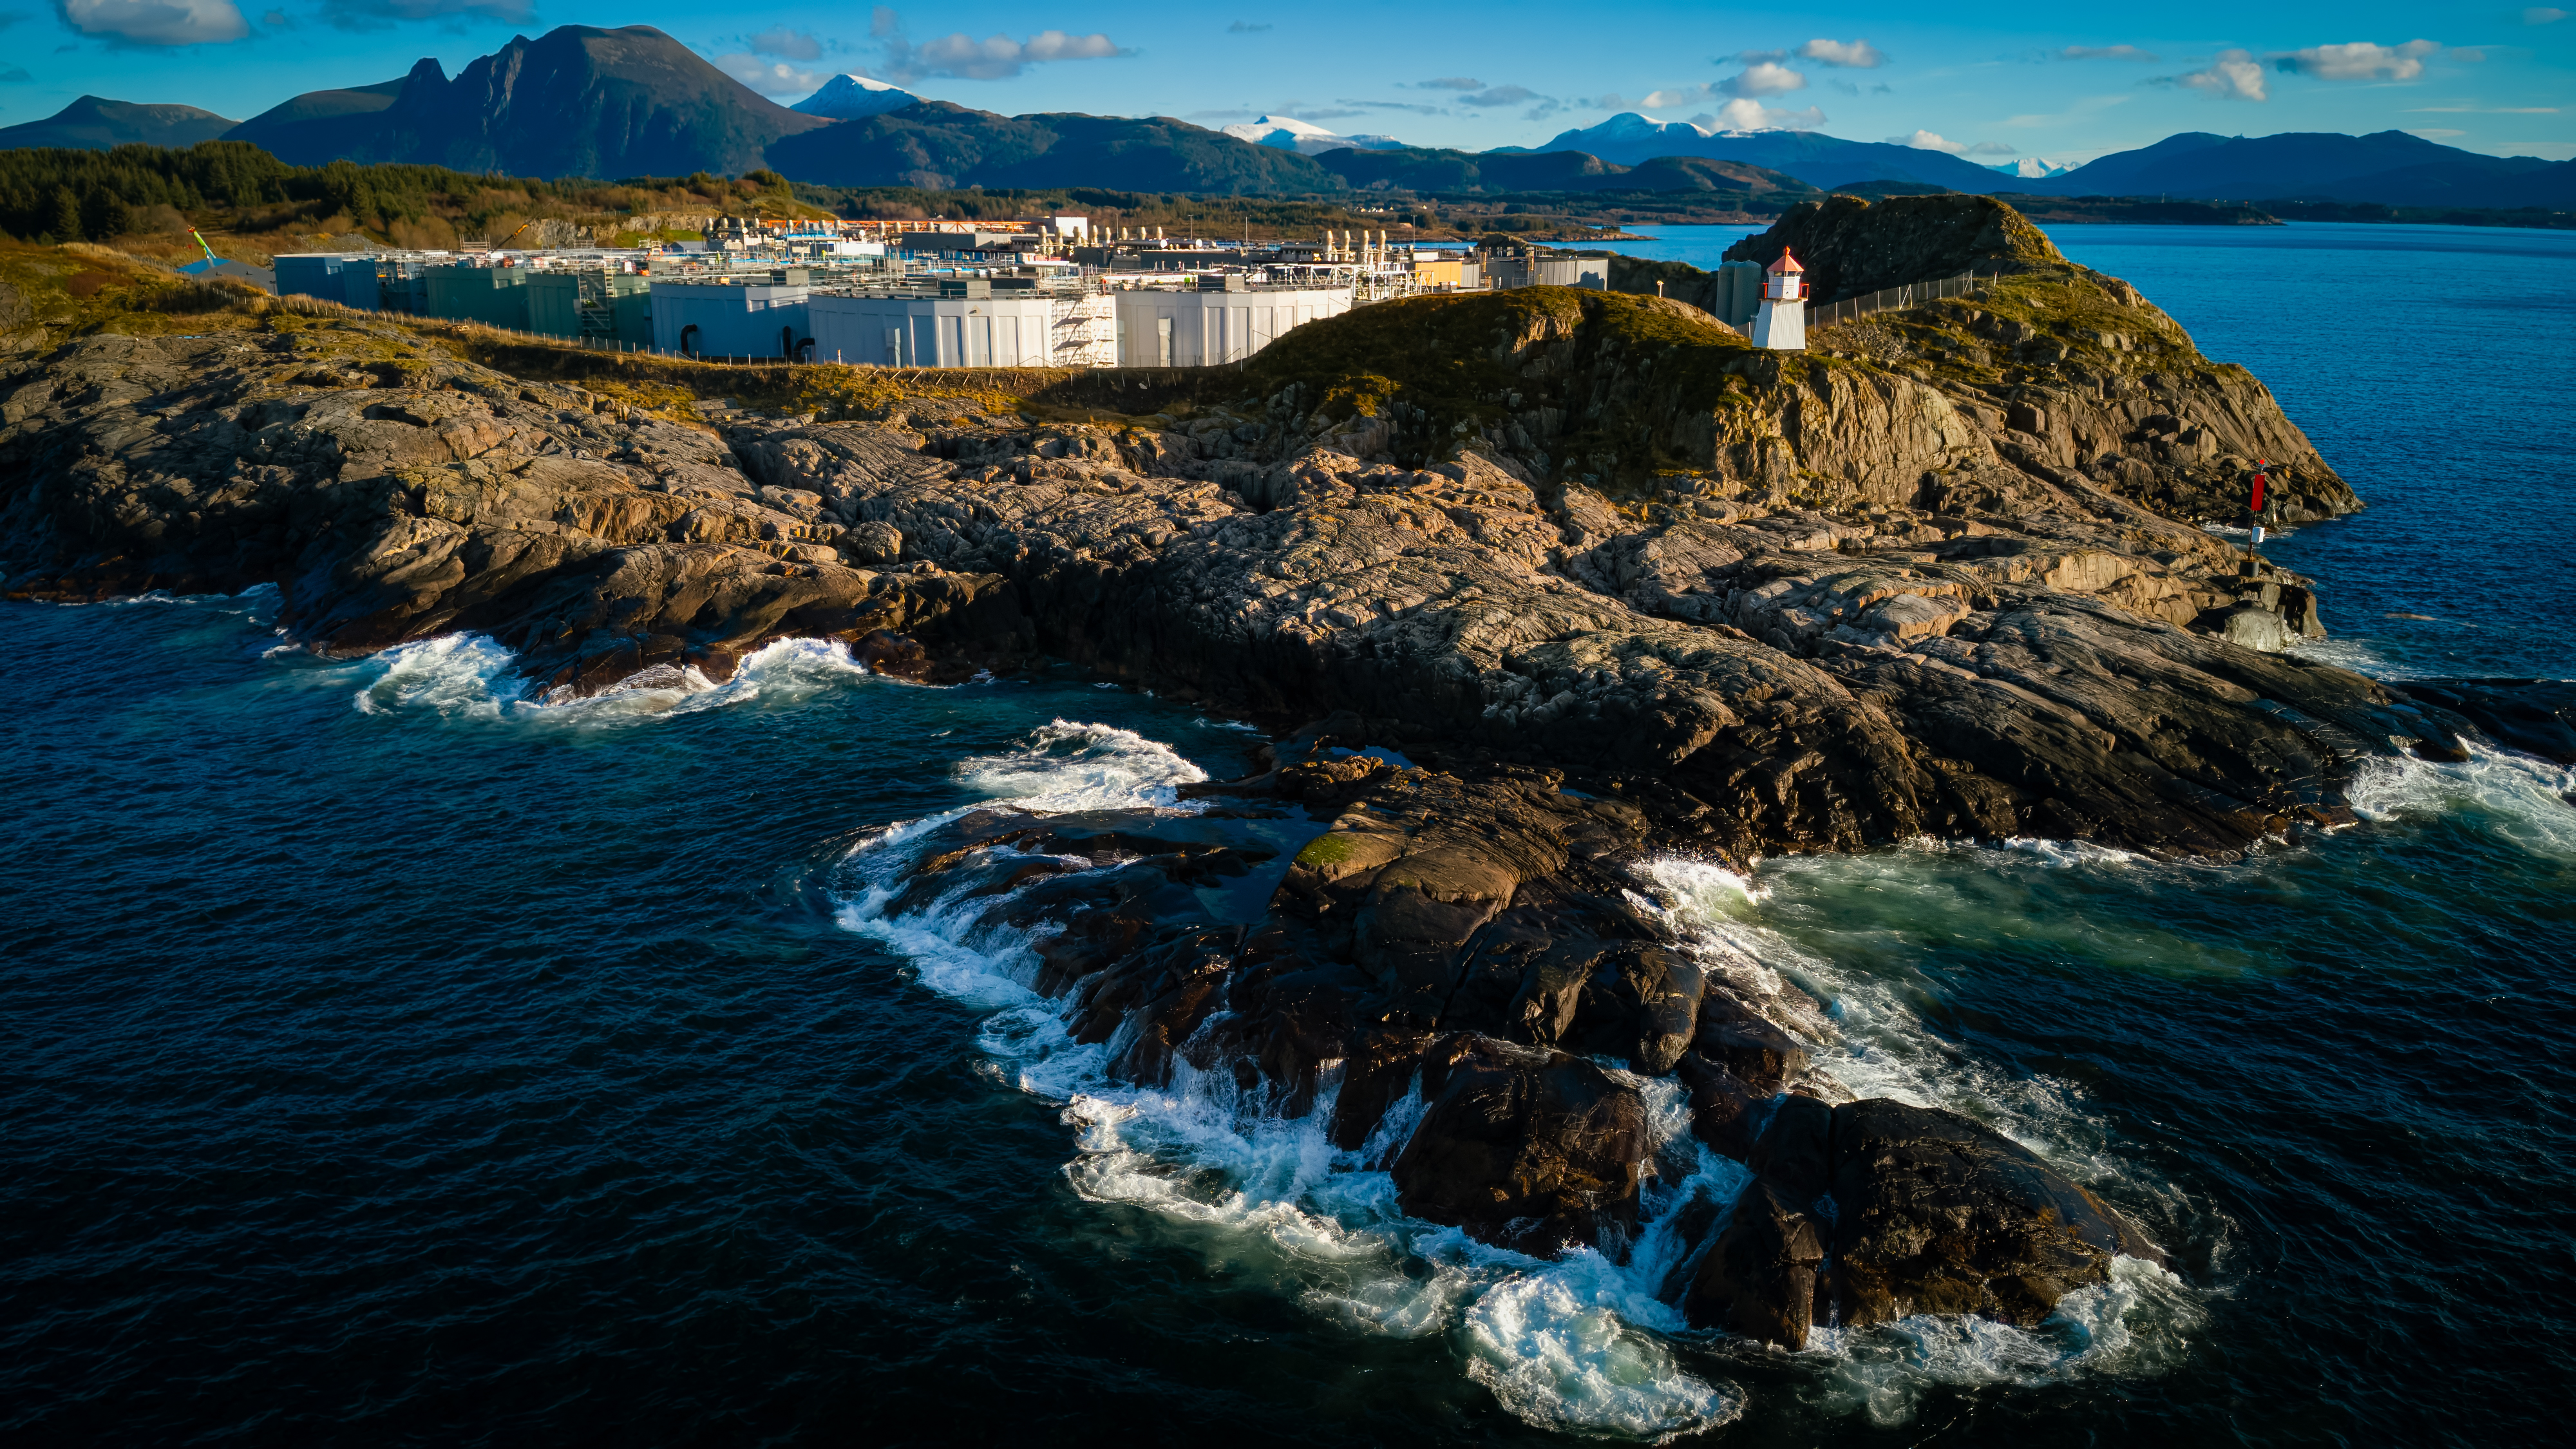
Farming Norway consists of the farming activities at the grow-out facility at Indre Harøy, smolt production at Salmon Evolution Dale and sales.
Salmon Evolution had revenues of 104.8 NOKm (86.6 NOKm) after harvesting 1,597 tonnes HOG in Q3 versus 1,387 tonnes HOG in the same quarter last year, up 15 %. The superior grade share was in line with Q2-26 and the long-term trend, and the average harvest weight was impacted by harvest of an underperforming fish group, also impacting the average price achieved as the Company had more fish in the 2-3 kg HOG category than normal. Harvest mostly took place in August and September.
Operating expenses ended at 118.1 NOKm (117.2 NOKm), reflecting higher harvest volumes in Q3-26 compared to Q3-25. In relation to preparation, testing and initiation of phase 2, the Company is taking some costs, and this amounted to 3.6 NOKm in capacity adjustments for Q3 – these costs were capitalized on the Indre Harøy phase 2 expansion project as part of testing related to initiation of operations.
Farming EBITDA cost/kg ended at 71.3 NOK/kg in Q3-26 versus 81.8 NOK/kg the same quarter last year. The negative cost impact from harvesting of the underperforming group was about 3 NOK/kg in Q3-26, primarily related to lower smolt yield and a higher-than-normal feed factor. Underlying normalized farming EBITDA cost/kg thus ended around 68 NOK/kg.
The Company has high focus on operational cost improvements. Phase 2 doubles production volumes, significantly strengthening the Company’s negotiating position with suppliers. In parallel with initiating operations in phase 2, the Company has an ongoing cost improvement program.
Operational EBITDA in the Farming segment ended at -13.3 NOKm (-30.6 NOKm), reflecting somewhat higher salmon prices and 13 % lower farming costs compared to the corresponding period last year.
Depreciations in the period ended at 20.3 NOKm, leaving Operational EBIT for Q3-26 at -33.6 NOKm.
Other
| (in NOK thousand) | Q3 2026 | Q3 2025 | YTD 2026 | YTD 2025 | 2025 |
|---|---|---|---|---|---|
| Operating revenue | 10 915 | 7 744 | 29 735 | 23 466 | 34 272 |
| Operational EBITDA | -6 907 | -9 889 | -23 201 | -30 742 | -39 203 |
In the Other segment all the resources related to projects and technology are employed, as well as general corporate functions.
In Q3-26 the Other segment recorded operating revenues of 10.9 NOKm (7.7 NOKm). Revenues in this segment are in all material respect related to sale of services to the Farming segment and the Indre Harøy phase 2 expansion.
The Other segment's cost base is mainly driven by salaries, which account for approximately 2/3rds of total operating expenses. This reflects the segment's focus on support and headquarter functions, including both general corporate functions and resources dedicated to projects and technology. Part of these salary costs are reinvoiced to the Farming segment, corresponding to services provided. Additionally, salaries relating to personnel involved in the Indre Harøy phase 2 expansion project are included in this segment's cost allocation.
Over the last two years, the Company has significantly reduced spending across headquarters and growth functions, reflecting a strategic reassessment of growth priorities as well as weaker salmon prices. Annual cash burn is reduced by approximately 20 NOKm compared to the 2024 level, with the full impact realized from year-end 2026. Key measures include reductions in headcount, growth-related expenditure and general spending, including seven fewer administrative FTEs over the past 12–18 months. The cash-burn reduction does not translate fully into P&L savings, as certain measures affect cash expenditure without a corresponding direct impact on the income statement.
Operating expenses totaled 17.8 NOKm (17.6 NOKm), in line with the 2026 run-rate and Q2-numbers.
The operational EBITDA ended at -6.9 NOKm (-9.9 NOKm).
Group
| (in NOK thousand) | Q3 2026 | Q3 2025 | YTD 2026 | YTD 2025 | 2025 |
|---|---|---|---|---|---|
| Total operating revenue and other income | 104 852 | 86 475 | 323 776 | 227 284 | 326 022 |
| Operational EBITDA2 | -20 200 | -40 507 | -21 891 | -70 255 | -78 686 |
| Operational EBIT | -41 045 | -61 470 | -83 584 | -133 730 | -158 906 |
| Fair value adjustment of biomass | 17 688 | 25 697 | -14 677 | -2 581 | 15 630 |
| Operating Profit (EBIT) | -23 357 | -35 773 | -98 261 | -136 311 | -143 276 |
| Net financial | -2 326 | -10 528 | -9 050 | -36 437 | -28 324 |
| Profit (loss) before tax | -25 683 | -46 301 | -107 311 | -172 748 | -171 601 |
| 2 Before fair value adjustment related to biological assets | |||||
The Group is the consolidated accounts of Salmon Evolution and consists of the Farming and Other segment.
Company revenues amounted to 104.9 NOKm (86.5 NOKm) in Q3-26, all related to sales of head-on gutted salmon and reflecting somewhat higher salmon prices and 15 % higher harvest volume y/y.
Operating expenses totaled 125.1 NOKm (127.0 NOKm). Operating expenses for the Company are in all material respect related to the Dale smolt facility and Indre Harøy grow-out facility, and other administrative expenses.
Operational EBITDA in the quarter ended at -20.2 NOKm (-40.5 NOKm), reflecting lower farming and growth costs compared to the corresponding period last year, and a higher harvest volume.
Depreciations in Q3-26 ended at 20.8 NOKm and the fair value adjustment amounted to 17.7 NOKm. This left the operating loss at 23.4 NOKm.
Net financials for the quarter were -2.3 NOKm (-10.5 NOKm). The Company recorded no tax cost in Q3-26. For the period the result ended at -25.7 NOKm (negative 46.3 NOKm).
Salmon Evolution’s share of K Smart’s net income is recognized in the profit and loss statement. The investment in K Smart is accounted for by using the equity method where K Smart is considered an associated company.
Cash flow
| (in NOK thousand) | Q3 2026 | Q3 2025 | YTD 2026 | YTD 2025 | 2025 |
|---|---|---|---|---|---|
| Net cash flow from operating activities | -1 502 | -40 610 | -50 010 | -82 050 | -59 052 |
| Net cash flow from investments activities | -199 028 | -348 748 | -728 341 | -861 268 | -1 252 431 |
| Net cash flow from financing activities | 113 771 | 416 951 | 808 716 | 670 210 | 1 045 458 |
| Net change in cash and cash equivalents | -86 760 | 27 594 | 30 364 | -273 108 | -266 024 |
| Cash and cash equivalents at start of period | 280 561 | 128 760 | 163 438 | 429 462 | 429 462 |
| Cash and cash equivalents at end of period | 193 802 | 156 354 | 193 802 | 156 354 | 163 438 |
Net cash flow from operating activities in Q3 amounted to NOK -1.5 million (NOK -40.6 million).
Investments in the quarter were in all material aspects related to the Indre Harøy phase 2 expansion project. The net cash flow from investment activities in the quarter ended at -199.0 NOKm (-348.7 NOKm).
Cash flow from financing ended at 113.8 NOKm (417.0 NOKm), primarily related to drawdowns on the construction financing. The overdraft facility was increased from 200 NOKm to 300 NOKm in October 2026.
Total change in cash and cash equivalents in the quarter ended at -86.8 NOKm (27.6 NOKm). Cash and cash equivalents ended at 193.8 NOKm excluding amounts available under the existing bank facilities.
Financial position
| (in NOK thousand) | 30 Sep 2026 | 30 Sep 2025 |
|---|---|---|
| Non-current assets | 4 523 364 | 3 306 008 |
| Current assets | 535 460 | 501 301 |
| Total assets | 5 058 825 | 3 807 309 |
| Equity | 2 348 359 | 2 053 837 |
| Non-current liabilities | 2 263 969 | 1 195 453 |
| Current liabilities | 446 497 | 558 019 |
| Total equity and liabilties | 5 058 825 | 3 807 309 |
On 30 September 2026 the book value of the Company’s assets was 5,058.8 NOKm (3,807.3 NOKm). The increase from previous periods is primarily related to the ongoing Indre Harøy phase 2 expansion project.
The fixed assets in the Company mostly relate to the facility at Indre Harøy, comprising land, buildings, and production equipment, as well as the Dale smolt facility and other smaller items.
Current assets in the Company are primarily biological assets, receivables, and cash & cash equivalents.
Total equity amounted to 2,348.4 NOKm which corresponds to an equity ratio of 46%.
Consolidated net interest-bearing debt totalled 2,286.3 NOKm at the end of the quarter.
Share information
As per 30 September 2026 DNB Asset Management AS was the Company’s largest shareholder with 40,097,515 shares, corresponding to 7.2% of the total number of shares outstanding. The 20 largest shareholders held 56.7% of the shares in the Company.
Source: Monitor Holdings, Company
Responsibility Statement
Responsibility statement in connection with interim management report by the Board of Directors and CEO of Salmon Evolution ASA.
We confirm, to the best of our knowledge, that the condensed set of financial statements for the period 1 January to 30 September 2026 has been prepared in accordance with IAS 34 – Interim Financial Reporting and gives a true and fair view of the Company’s assets, liabilities, financial position and profit or loss as a whole. We also confirm, to the best of our knowledge, that the interim management report includes a fair review of important events that have occurred during the period and their impact on the condensed set of financial statements, a description of the principal risks and uncertainties facing the Company, and major related parties’ transactions.
The Board of Directors of Salmon Evolution ASA
Ålesund/Elnesvågen 27 October 2026
Tore Tønseth
Chair
Peder Stette
Director
Anne Breiby
Director
Vibecke Bondø
Director
Trond Håkon Schaug-Pettersen
CEO
Jan-Emil Johannessen
Director