
Group financial review
Revenue and results for the second quarter 2026Comparable figures for Q2 2025 in brackets
Farming Norway
| (in NOK thousand) | Q2 2026 | Q2 2025 | 2025 |
|---|---|---|---|
| Operating revenue | 66 615 | 90 244 | 325 250 |
| Operational EBITDA2 | -3 022 | -13 247 | -39 483 |
| Operational EBIT2 | -22 699 | -33 919 | -116 399 |
| All-in price realization/kg (NOK)1 | 69,7 | 72,1 | 69,5 |
| Harvest volumes (tonnes, HOG) | 945 | 1 232 | 4 403 |
| Farming EBITDA cost/kg | 70,7 | 81,2 | 77,1 |
| Operational EBITDA/kg (NOK) | -3,2 | -10,8 | -9,0 |
| Operational EBIT/kg (NOK) | -24,0 | -27,5 | -26,4 |
| 1 Calculated on a back to farm basis and adjusted for transport cost to Norway border (Sisalmoni equivalent) | |||
| 2 Before fair value adjustment related to biological assets | |||
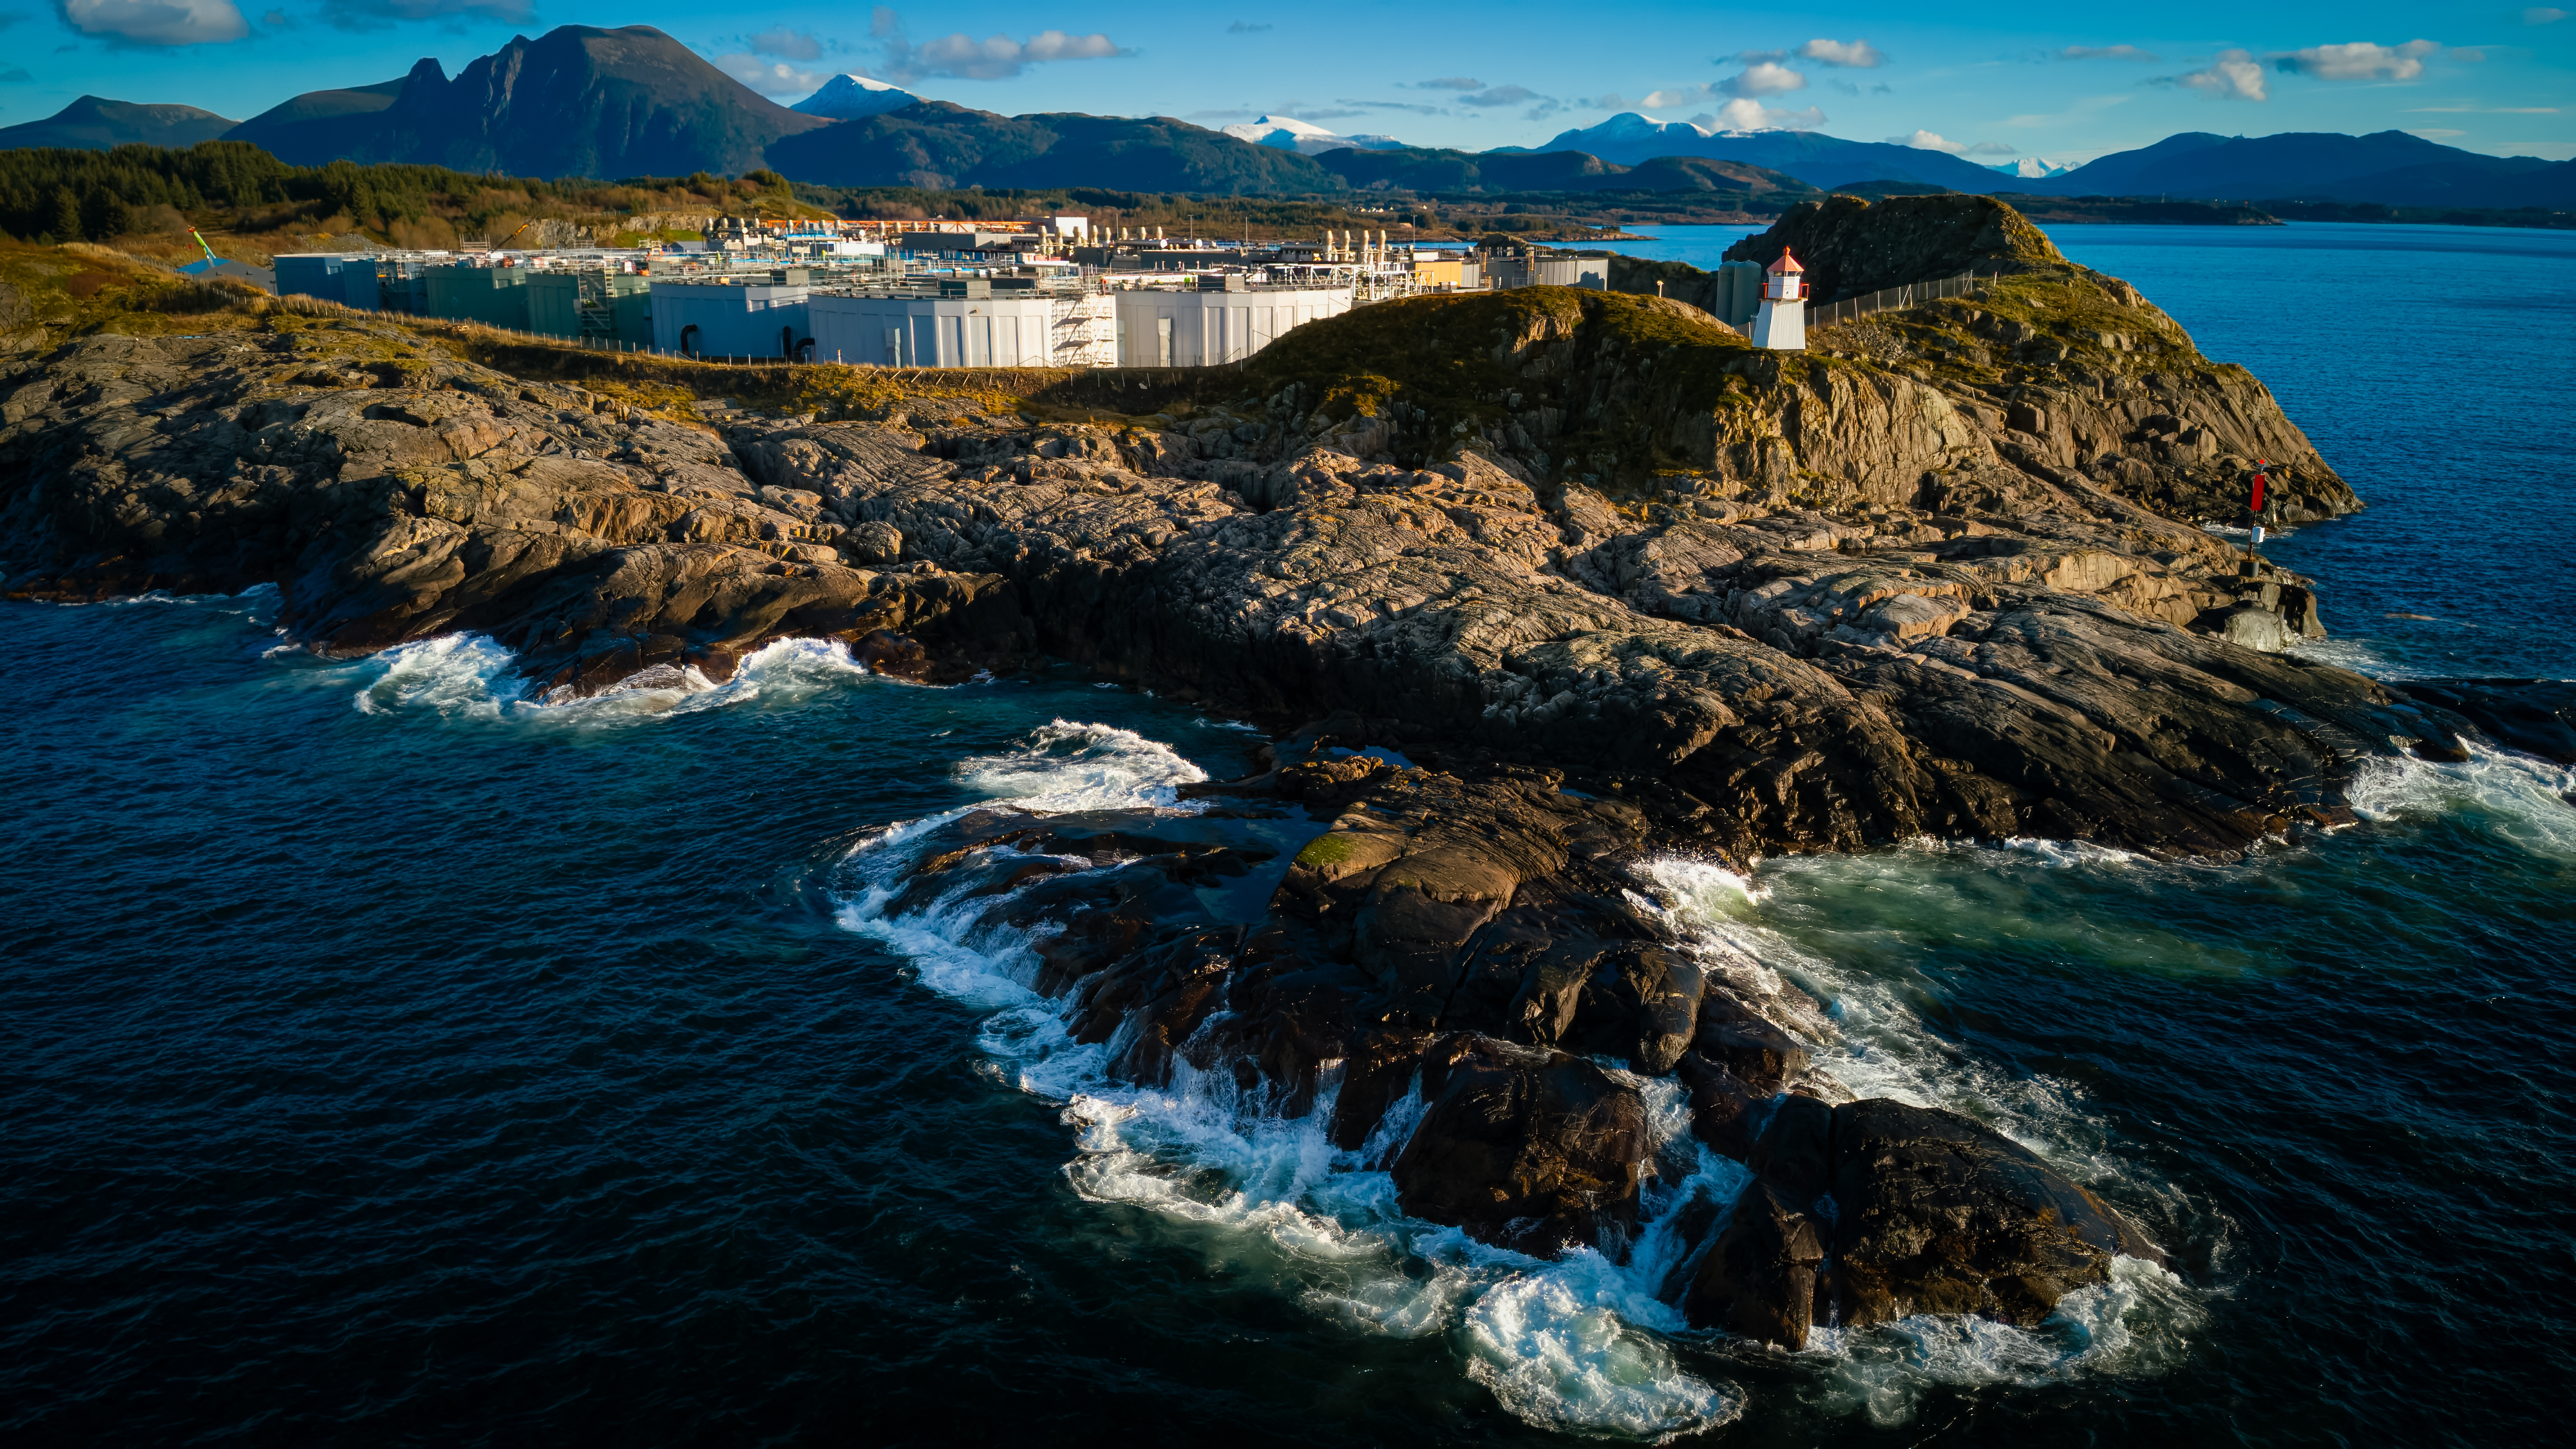
Farming Norway consists of the farming activities at the grow-out facility at Indre Harøy, smolt production at Salmon Evolution Dale and sales.
Salmon Evolution harvested 945 tonnes HOG in the quarter versus 1,232 tonnes HOG in the same quarter last year, with average harvest weights and superior grade share in line with Q1-26. The second quarter generated revenues of 66.6 NOKm (90.2 NOKm) with an all-in price realization of 69.7 NOK/kg during the quarter, down 3 % y/y. The all-in price realization reflects that harvest activity took place during May and early June.
Operating expenses ended at 69.6 NOKm (103.5 NOKm), reflecting lower harvest volumes in Q2-26 than in Q2-25. In relation to preparation, testing and initiation of phase 2, the Company is taking some costs, and this amounted to 7.4 NOKm in capacity adjustments for Q2 – these cost where capitalized on the Indre Harøy phase 2 expansion project as part of testing related to initiation of operations.
Farming EBITDA cost/kg ended at 70.7 NOK/kg, down from 72.6 NOK/kg in Q1-26 and 81.2 NOK/kg the same quarter last year.
Operational EBITDA in the Farming segment ended at -3.0 NOKm (-13.2 NOKm), reflecting lower Farming cost compared to the corresponding period last year.
Depreciations in the period ended at 19.7 NOKm, leaving Operational EBIT for Q2-26 at -22.7 NOKm.
Other
| (in NOK thousand) | Q2 2026 | Q2 2025 | 2025 |
|---|---|---|---|
| Operating revenue | 9 236 | 7 961 | 34 272 |
| Operational EBITDA | -8 097 | -12 410 | -39 203 |
In the Other segment all the resources related to projects and technology are employed, as well as general corporate functions. A significant portion of costs are related to future expansion.
In Q2-26 the Other segment recorded operating revenues of 9.2 NOKm (8.0 NOKm). Revenues in this segment are in all material respect related to sale of services to the Farming segment and growth projects – primarily the Indre Harøy phase 2 expansion.
The Other segment's cost base is mainly driven by salaries, which account for approximately 71% of total operating expenses. This reflects the segment's focus on support and headquarter functions, including both general corporate functions and resources dedicated to projects and technology. Part of these salary costs are reinvoiced to the Farming segment, corresponding to services provided. Additionally, salaries relating to personnel involved in the Indre Harøy phase 2 expansion project are included in this segment's cost allocation.
Operating expenses totaled 17.3 NOKm (20.4 NOKm), in line with the 2026 run-rate and Q1-numbers. Cash burn on growth projects outside phase 2 at Indre Harøy has been reduced to a minimum, and other cost saving measures has been implemented including not filling vacant positions at administrative level leading to a reduction of headcount of 5 FTEs through 2025 and into 2026.
The operational EBITDA ended at -8.1 NOKm (-12.4 NOKm).
Group
| (in NOK thousand) | Q2 2026 | Q2 2025 | 2025 |
|---|---|---|---|
| Total operating revenue and other income | 66 685 | 91 141 | 326 022 |
| Operational EBITDA2 | -11 118 | -25 656 | -78 686 |
| Operational EBIT | -31 239 | -46 846 | -158 906 |
| Fair value adjustment of biomass | -5 499 | -9 022 | 15 630 |
| Operating Profit (EBIT) | -36 738 | -55 868 | -143 276 |
| Net financial | -6 698 | -15 878 | -28 324 |
| Profit (loss) before tax | -43 436 | -71 746 | -171 601 |
| 2 Before fair value adjustment related to biological assets | |||
The Company is the consolidated accounts of Salmon Evolution and consists of the Farming and Other segment.
Company revenues amounted to 66.7 NOKm (91.1 NOKm) in Q2-26, all related to sales of head-on gutted salmon and reflecting lower harvest volume y/y.
Operating expenses totaled 77.8 NOKm (116.8 NOKm). Operating expenses for the Company are in all material respect related to the Dale smolt facility and Indre Harøy grow-out facility, and other administrative expenses.
Operational EBITDA in the quarter ended at -11.1 NOKm (-25.7 NOKm), reflecting lower Farming cost compared to the corresponding period last year.
Depreciations in Q2-26 ended at 20.1 NOKm and the fair value adjustment amounted to -5.5 NOKm. This left the operating loss at 36.7 NOKm.
Net financials for the quarter were -6.7 NOKm (-15.9 NOKm). The Company recorded no tax cost in Q2-26. For the period the result ended at -43.4 NOKm (negative 71.7 NOKm).
Salmon Evolution’s share of K Smart’s net income is recognized in the profit and loss statement. The investment in K Smart is accounted for by using the equity method where K Smart is considered an associated company.
Cash flow
| (in NOK thousand) | Q2 2026 | Q2 2025 | 2025 |
|---|---|---|---|
| Net cash flow from operating activities | -23 674 | -33 886 | -56 261 |
| Net cash flow from investments activities | -240 528 | -271 811 | -1 252 431 |
| Net cash flow from financing activities | 407 470 | 16 574 | 1 045 458 |
| Net change in cash and cash equivalents | 143 267 | -289 123 | -263 233 |
| Cash and cash equivalents at start of period | 137 294 | 417 884 | 429 462 |
| Cash and cash equivalents at end of period | 280 561 | 128 761 | 163 438 |
Net cash flow from operating activities in Q2 amounted to NOK -23.7 million (NOK -33.9 million), mainly reflecting working capital movements in the period, with harvesting towards the end of the quarter impacting the cash flow.
Investments in the quarter, was in all material aspects related to the Indre Harøy phase 2 expansion project. The net cash flow from investment activities in the quarter ended at - 240.5 NOKm (-271.8 NOKm).
Cash flow from financing ended at 407.5 NOKm (positive 16.6 NOKm), primarily related to raising gross proceeds of 411.3 NOKm in equity, in addition to drawdowns on the construction financing net of interest paid in the period.
Total change in cash and cash equivalents in the quarter ended at 143.3 NOKm (-289.1 NOKm). Cash and cash equivalents ended at 280.6 NOKm excluding amounts available under the existing bank facilities.
Financial position
| (in NOK thousand) | 30 June 2026 | 30 June 2025 |
|---|---|---|
| Non-current assets | 4 332 114 | 2 972 149 |
| Current assets | 601 556 | 456 216 |
| Total assets | 4 933 669 | 3 428 366 |
| Equity | 2 373 561 | 2 099 985 |
| Non-current liabilities | 2 103 715 | 854 738 |
| Current liabilities | 456 394 | 473 642 |
| Total equity and liabilties | 4 933 669 | 3 428 366 |
On 30 June 2026 the book value of the Company’s assets was 4,933.7 NOKm (3,428.4 NOKm). The increase from previous periods is primarily related to the ongoing Indre Harøy phase 2 expansion project.
The fixed assets in the Company mostly relate to the facility at Indre Harøy, comprising land, buildings, and production equipment, as well as the Dale smolt facility and other smaller items. There are no
movements from the previous quarter, apart from the increase in fixed assets related to the Indre Harøy phase 2 project.
Current assets in the Company are primarily biological assets, receivables, and cash & cash equivalents.
Total equity amounted to 2,373.6 NOKm which corresponds to an equity ratio of 48%.
Consolidated net interest-bearing debt totalled 2,039.7 NOKm at the end of the quarter.
Share information
As per 30 June 2026 Ronja Capital Investment AS was the Company’s largest shareholder with 38,701,756 shares, corresponding to 7.0% of the total number of shares outstanding. The 20 largest shareholders held 56.6% of the shares in the Company.
During the quarter the average daily traded volume was about 980,000 shares.
Salmon Evolution ASA was listed on Oslo Børs on 9 July 2021.
Source: Monitor Holdings, Company