
Interim financial statements
Statement of Profit and Loss
| (in NOK thousand) | Note | Q4 2025 | Q4 2024 | 2025 | 2024 |
|---|---|---|---|---|---|
| Sales revenue from farming | 2 | 98 739 | 148 687 | 325 250 | 467 742 |
| Other income | 0 | 848 | 772 | 3 831 | |
| Total operating revenue and other income | 98 739 | 149 535 | 326 022 | 471 573 | |
| Change in inventory | 3 | 6 086 | -28 451 | 43 711 | 29 603 |
| Cost of materials | 3 | -65 609 | -55 525 | -203 064 | -200 933 |
| Personnel expenses | -16 866 | -12 852 | -80 998 | -68 046 | |
| Other operating expenses | -30 780 | -43 459 | -164 357 | -160 781 | |
| Operational EBITDA | -8 431 | 9 248 | -78 686 | 71 415 | |
| Depreciations | 4 | -16 746 | -20 539 | -80 221 | -76 142 |
| Operational EBIT | -25 177 | -11 291 | -158 906 | -4 727 | |
| Fair value adjustment of biomass | 3 | 18 211 | -10 493 | 15 630 | -10 498 |
| Operating Profit (EBIT) | -6 966 | -21 784 | -143 276 | -15 225 | |
| Financial income | 5 | -1 935 | 10 813 | 9 746 | 28 239 |
| Financial expense | 5 | 10 305 | -13 191 | -32 593 | -52 610 |
| Share of net income from associated companies | -257 | -2 763 | -5 478 | -7 809 | |
| Net financial | 8 113 | -5 141 | -28 324 | -32 180 | |
| Profit/loss before tax | 1 147 | -26 925 | -171 601 | -47 405 | |
| Income tax expense | 6 | 0 | 0 | 0 | 0 |
| Profit/loss for the period | 7 | 1 147 | -26 925 | -171 601 | -47 405 |
| Basic earnings per share (NOK) | 7 | 0,00 | 0,00 | -0,37 | -0,11 |
| Diluted earnings per share (NOK) | 7 | 0,00 | 0,00 | -0,37 | -0,11 |
| Consolidated statement of comprehensive income | |||||
| Profit/(loss) for the period | 1 147 | -26 925 | -171 601 | -47 405 | |
| Currency translation differences | 5 | -1 297 | -479 | 862 | -178 |
| Total comprehensive income for the period, net of tax | -150 | -27 404 | -170 738 | -47 584 |
Statements of financial position
| (in NOK thousand) | Note | 31 Des 2025 | 31 Des 2024 |
|---|---|---|---|
| Assets | |||
| Intangible assets | 4 | 84 508 | 81 101 |
| Assets under construction | 4 | 1 781 081 | 481 778 |
| Property, plant & equipment | 4 | 1 805 987 | 1 824 284 |
| Right-of-use assets | 4 | 45 513 | 17 857 |
| Investment in associated companies | 6 073 | 10 689 | |
| Other long-term receivables | 13 169 | 0 | |
| Total non-current assets | 3 736 330 | 2 415 709 | |
| Inventory | 3 | 11 351 | 12 866 |
| Biological assets | 3 | 232 335 | 171 004 |
| Trade receivables | 10 314 | 90 522 | |
| Other current receivables | 51 585 | 51 142 | |
| Financial derivatives | 5 | 10 254 | 13 643 |
| Cash and cash equivalents | 163 438 | 429 462 | |
| Total current assets | 479 276 | 768 639 | |
| Total assets | 4 215 607 | 3 184 348 | |
| Equity and liabilities | |||
| Share capital | 8 | 23 130 | 23 130 |
| Share premium | 8 | 2 414 997 | 2 415 049 |
| Other reserves | 13 310 | 11 483 | |
| Uncovered losses | -388 765 | -226 402 | |
| Total equity | 2 062 673 | 2 223 260 | |
| Long-term interest-bearing debt | 9 | 1 545 228 | 569 100 |
| Lease liabilities - long term | 9 | 30 088 | 9 668 |
| Other long-term liabilities | 9 | 3 643 | 3 643 |
| Total non-current liabilities | 1 578 959 | 582 411 | |
| Short-term interest-bearing debt | 9 | 334 571 | 158 488 |
| Trade payables | 192 047 | 193 384 | |
| Social security and other taxes | 7 527 | 7 080 | |
| Lease liabilities - short term | 9 | 10 987 | 5 317 |
| Other short-term liabilities | 28 842 | 14 408 | |
| Total current liabilities | 573 975 | 378 677 | |
| Total liabilities | 2 152 934 | 961 088 | |
| Total equity and liabilities | 4 215 607 | 3 184 348 |
Statement of cash flow
| (in NOK thousand) | Note | Q4 2025 | Q4 2024 | 2025 | 2024 |
|---|---|---|---|---|---|
| Profit/loss before tax | -150 | -26 925 | -170 738 | -47 405 | |
| Adjustments for: | |||||
| Depreciation, amortisation and impairment loss | 4 | 16 746 | 20 539 | 80 221 | 76 142 |
| Net financials | -8 113 | 5 141 | 28 324 | 32 180 | |
| Share based payment expenses | -661 | 355 | -1 827 | 726 | |
| Reversal of prior-period depreciation | 4 252 | 0 | 4 252 | 0 | |
| Changes in working capital: | |||||
| Change in trade receivables | 26 537 | -75 858 | 67 598 | -50 026 | |
| Change in other current receivables | 2 365 | -6 793 | -3 808 | -11 073 | |
| Change in inventory and biological assets | 3 | -8 083 | 28 072 | -41 438 | -32 209 |
| Change in fair value of biomass | 3 | -18 211 | 10 493 | -15 630 | 10 498 |
| Change in trade payables | -1 419 | 40 075 | -4 937 | 65 583 | |
| Change in social security and other taxes | 2 801 | 2 836 | 442 | -779 | |
| Change in other current liabilities | 2 682 | 3 029 | -1 511 | -306 | |
| Cash (outflow) from operations | 18 746 | 965 | -59 052 | 43 331 | |
| Cash flow from investment activities | |||||
| Payments for fixed assets | 4 | -391 573 | -167 592 | -1 260 474 | -358 584 |
| Proceeds from government grants | 0 | 0 | 2 258 | 764 | |
| Payments for intangible assets | 4 | -1 678 | -7 757 | -3 960 | -12 176 |
| Financial income received | 6 341 | 19 853 | 9 746 | 27 434 | |
| Net cash (outflow) from investment activities | -386 911 | -155 496 | -1 252 431 | -342 562 | |
| Cash flow from financing activities | |||||
| Proceeds from issue of equity | 0 | 0 | 0 | 365 000 | |
| Transaction costs | 0 | -116 | 0 | -15 575 | |
| Proceeds from new borrowings | 9 | 412 765 | 35 484 | 1 153 412 | 50 185 |
| Repayment of borrowings | -300 | -300 | -1 200 | -900 | |
| Payments of principal portion of lease liabilities | -2 277 | -1 665 | -12 173 | -5 354 | |
| Interest paid lease liabilities | -685 | -163 | -2 503 | -941 | |
| Financial expenses paid | -34 255 | -12 498 | -92 078 | -50 118 | |
| Net cash (outflow) from financing activities | 375 247 | 20 742 | 1 045 458 | 342 297 | |
| Net change in cash and cash equivalents | 7 083 | -133 789 | -266 024 | 43 066 | |
| Cash and cash equ. at the beginning of the period | 156 354 | 563 251 | 429 462 | 386 396 | |
| Cash and cash equ. at the end of the period | 163 437 | 429 462 | 163 438 | 429 462 |
Statement of Changes in Equity
| (in NOK thousand) | Note | Share capital | Share premium | Other reserves | Other equity | Uncovered losses | Total equity |
|---|---|---|---|---|---|---|---|
| Balance at 1 January 2024 | 8 | 20 697 | 2 124 647 | 10 758 | 0 | -235 408 | 1 920 693 |
| Profit/loss for the period | 0 | 0 | 0 | 0 | -47 405 | -47 405 | |
| Other comprehensive income | 0 | 0 | 0 | 0 | -178 | -178 | |
| Total comprehensive income | 0 | 0 | 0 | 0 | -47 583 | -47 583 | |
| Private placement June 2024 | 2 433 | 362 567 | 0 | 0 | 0 | 365 000 | |
| Private placement, transaction costs | 0 | -15 575 | 0 | 0 | 0 | -15 575 | |
| Reclassification uncovered losses | 0 | -56 590 | 0 | 0 | 56 590 | 0 | |
| Share based payment expensed | 0 | 0 | 726 | 0 | 0 | 726 | |
| Transactions with owners | 2 433 | 290 402 | 726 | 0 | 56 590 | 350 151 | |
| Balance at 31 Dec 2024 | 8 | 23 130 | 2 415 049 | 11 483 | 0 | -226 402 | 2 223 260 |
| Balance at 1 January 2025 | 8 | 23 130 | 2 415 049 | 11 483 | 0 | -226 402 | 2 223 260 |
| Profit/loss for the period | 0 | 0 | 0 | 0 | -171 601 | -171 601 | |
| Other change | 0 | 0 | 0 | 0 | 8 376 | 8 376 | |
| Other comprehensive income | 0 | 0 | 0 | 0 | 862 | 862 | |
| Total comprehensive income | 0 | 0 | 0 | 0 | -162 363 | -162 363 | |
| Other paid-in capital | 0 | -51 | 0 | 0 | 0 | -51 | |
| Share based payment expensed | 0 | 0 | 1 827 | 0 | 0 | 1 827 | |
| Transactions with owners | 0 | -51 | 1 827 | 0 | 0 | 1 775 | |
| Balance at 31 Dec 2025 | 8 | 23 130 | 2 414 997 | 13 310 | 0 | -388 764 | 2 062 673 |
Selected notes to the quarterly financial statements
Note 1 Summary of significant accounting policies
General information
Salmon Evolution ASA and its subsidiaries, Salmon Evolution Norway AS, Salmon Evolution International AS, Salmon Evolution Dale AS and Salmon Evolution Sales AS (the “Company”, "SE" or "the Company") is a Norwegian land-based salmon farmer headquartered in Hustadvika kommune in Møre og Romsdal.
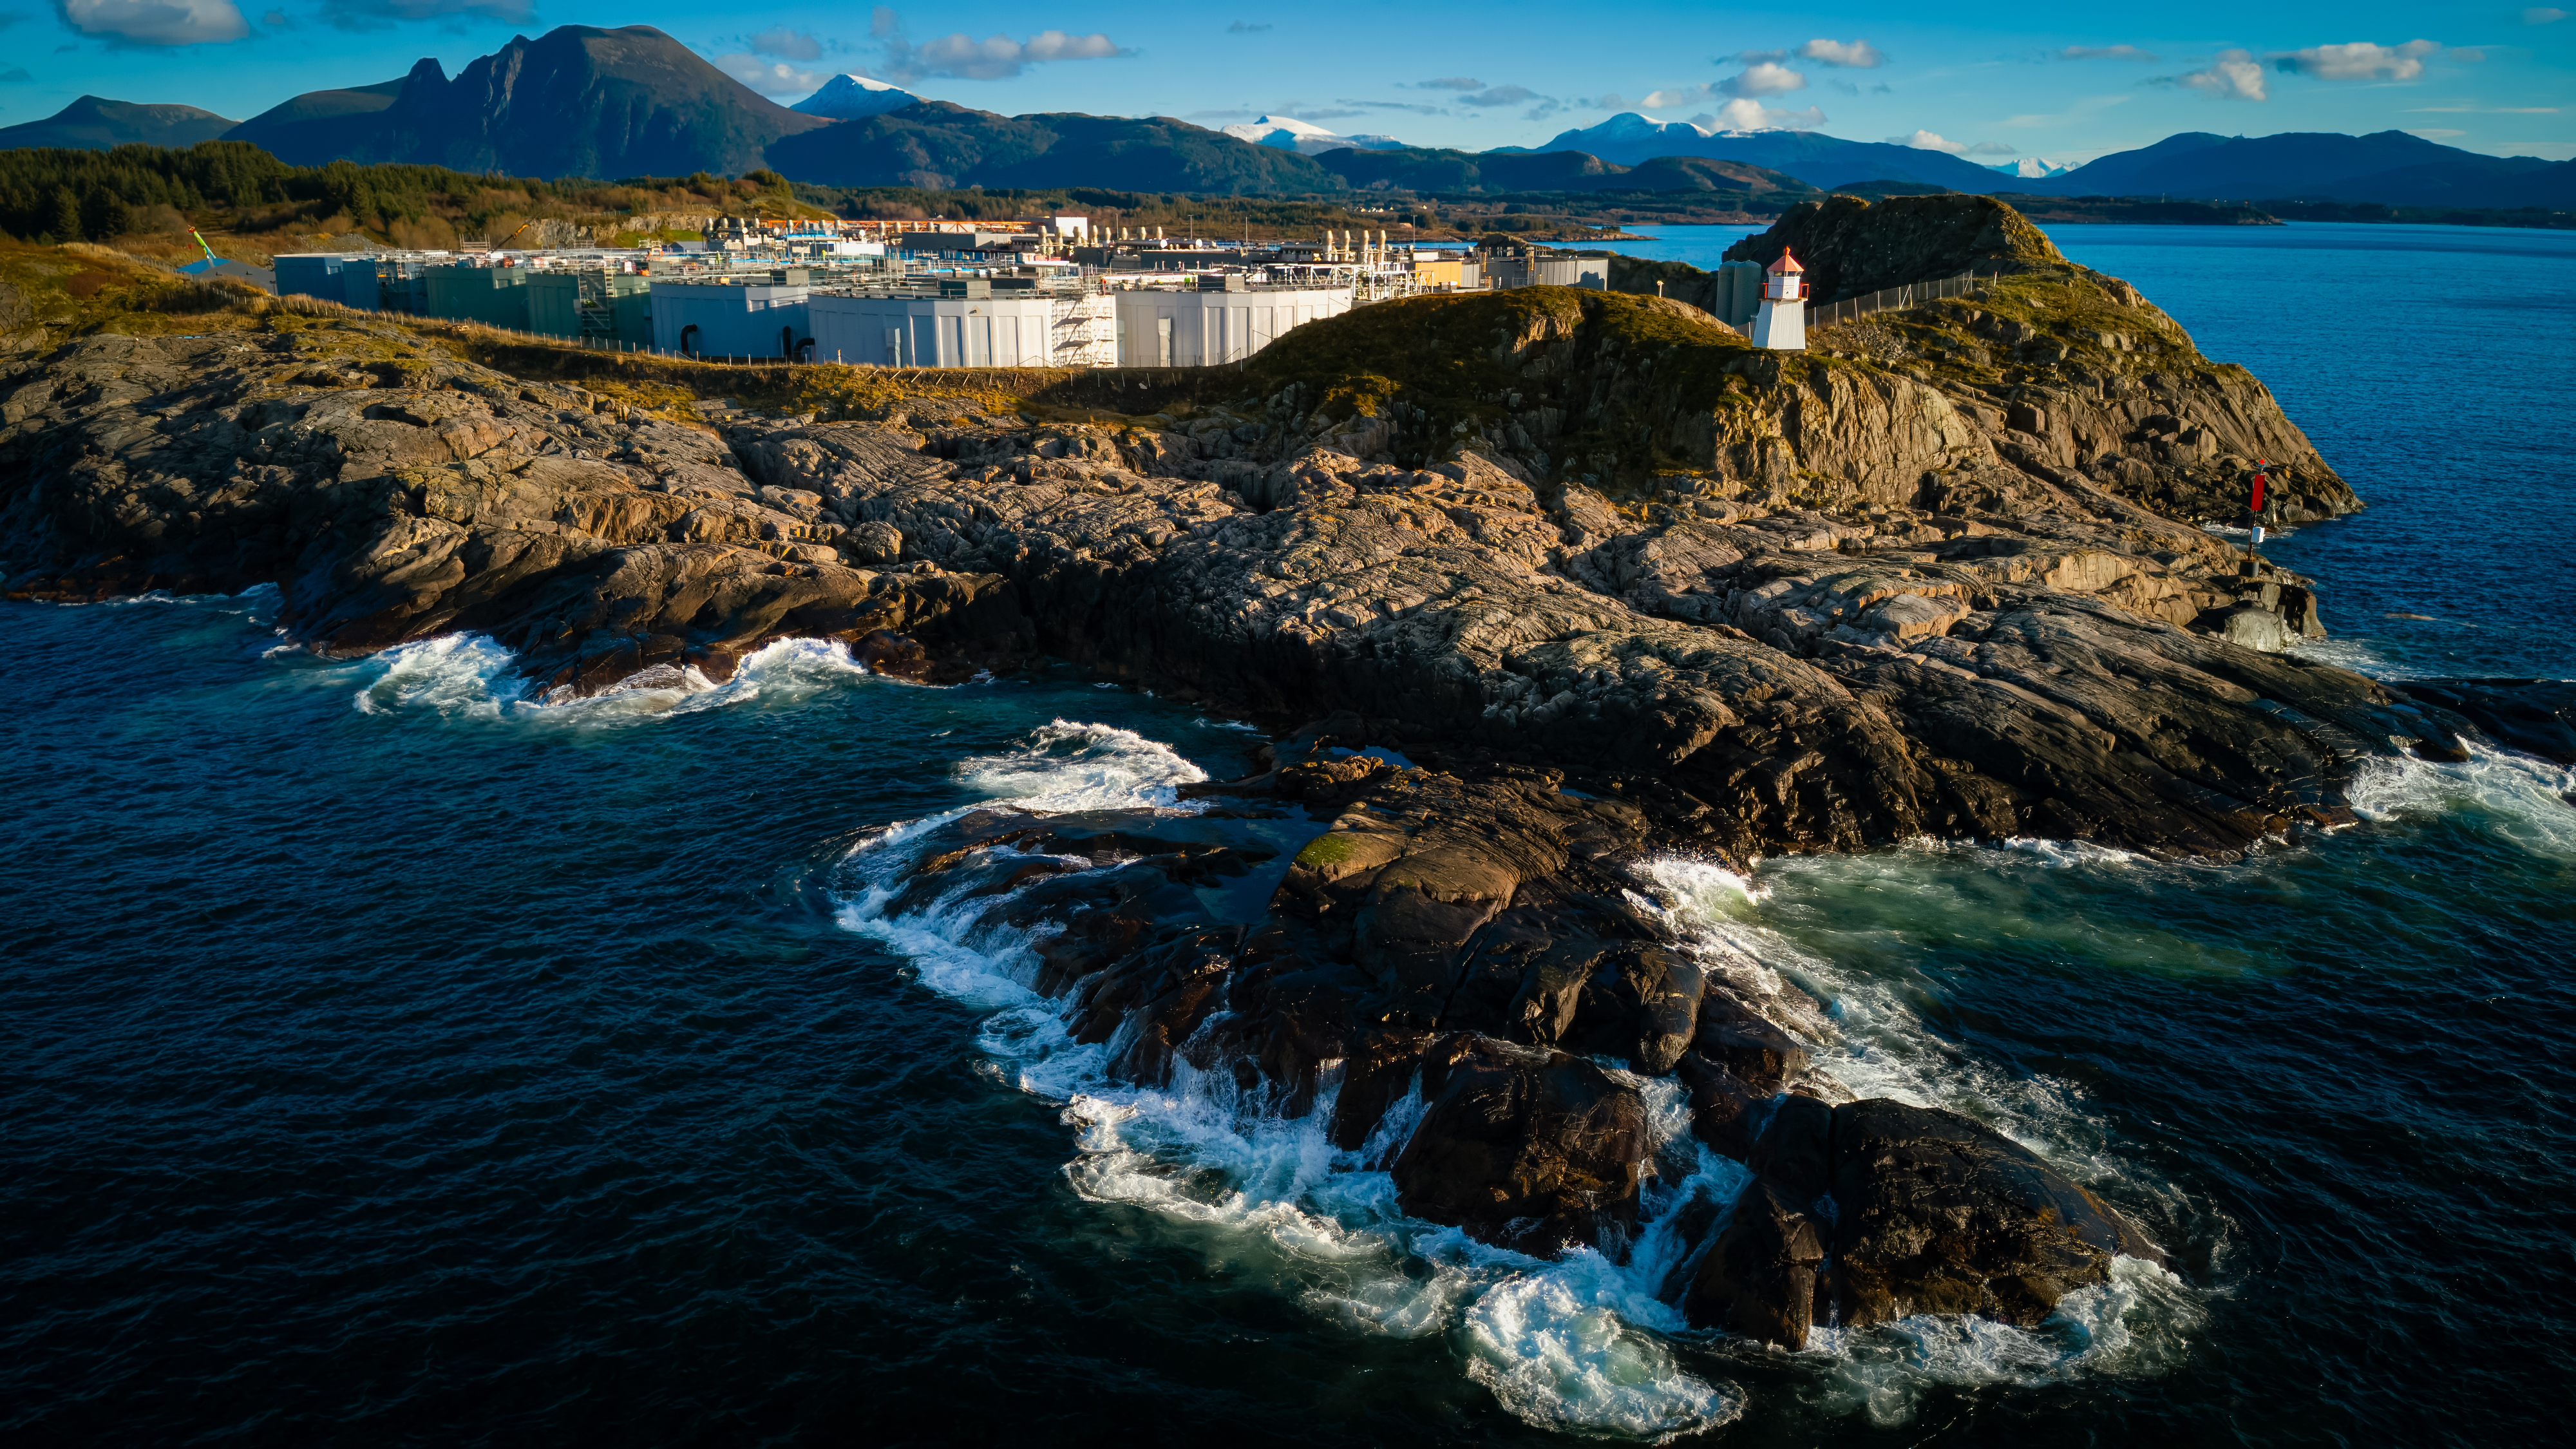
Salmon Evolution operates a hybrid flow-through (HFS) system, utilizing fresh seawater from the Norwegian coast. The Company is building a land-based salmon farming facility at Indre Harøy, with a planned annual production of 36,000 tons HOG fully built. Phase 1, with a planned annual production of 7,900 tons HOG, is fully operational, whilst construction of phase 2 planned to add an addition 10,100 tons HOG bringing total production up to 18,000 tons HOG was initiated in August 2024.
These interim financial statements were approved by the Board of Directors for issue on 23 February 2026.
These interim financial statements have not been audited.
Consolidation
These condensed consolidated statements for the period ended 31 December 2025 include Salmon Evolution ASA together with its subsidiaries Salmon Evolution Norway AS, Salmon Evolution International AS, Salmon Evolution Dale AS and Salmon Evolution Sales AS.
Basis of preparation
These interim financial statements have been prepared in accordance with International Accounting Standard 34, "Interim financial reporting". These interim financial statements do not provide the same scope of information as the annual financial statement and should therefore be read in conjunction with the annual financial statements for the year ended 31 December 2024, which have been prepared in accordance with IFRS® Accounting Standards as adopted by the EU.
Going concern
The Company has adopted the going concern basis in preparing its consolidated financial statements. When assessing this assumption, management has assessed all available information about the future. After making such assessments, management has a reasonable expectation that the Company has adequate resources to continue its operational existence for the foreseeable future.
Accounting policies
The accounting policies adopted are consistent with those of the previous financial year except that income tax expense is recognized in each interim period using the expected weighted average annual income tax rate for the full financial year. Taxes on income in the interim periods are accrued using the tax rate that would be applicable to expected total annual profit or loss. The Company does not include net deferred tax benefits in its balance that exceeds the tax effect of group contributions in order to equalize tax payable in its subsidiaries. From Q4-24 there has been a principal change in cash flow regarding lease liabilities from presenting change in lease liabilities to actual paid expenses.
Revenue
Revenue from contracts with customers as defined in IFRS 15 is recognised when control of the goods is transferred to the customer at an amount that reflects the consideration to which the Company expects to be entitled in exchange for those goods.
Revenue for the Company derives from sale of whole and processed salmon in the spot marked. The Company has limited forward sales contracts. The Company recognized revenue at the point in time when control of the goods is transferred to the customer at an amount that reflects the expected amount that the Company is entitled to have for the goods. The sales price is based on available market price where the price will vary with both quality and size.
Normal credit term of the sales transactions is 30 days. If the delivered products have discrepancies compared to the agreed sales contract, cash refunds are given to the customer.
Property, plant & equipment
Property, plant, and equipment is measured at cost, which includes capitalized borrowing costs, less accumulated depreciation and costs include expenditures that are directly attributable to the acquisition and placement of fixed assets in service. Costs of major replacements and renewals that substantially extend the economic life and functionality of fixed asset are capitalized. Costs associated with normal maintenance and repairs are expensed as incurred.
Assets are normally considered property, plant, and equipment if the useful economic life exceeds one year. Straight-line depreciation is applied over the useful life of property, plant, and equipment based on the asset’s historical cost. If a substantial part of an asset has an individual and different useful life, that portion is depreciated separately. The asset’s residual value and useful life are evaluated annually. Gains or losses arising from the disposal or retirement of an asset are determined as the difference between the sales proceeds and the carrying amount of the asset and recognized as part of other income in the accompanying statements of other comprehensive income.
Depreciation is charged to expense when the property, plant or equipment is ready for intended use. For the second phase build out, which is expected to be ready for intended use during 2026, assets under construction is not depreciated.
Biological assets
Biological assets are, in accordance with IAS 41, measured at fair value unless the fair value cannot be measured reliably. For salmon in the grow-out facility, a present value model is applied to estimate the fair value. For roe, fry and smolt, historical cost is deemed to provide the best estimate of fair value, and hence applied.
Cost of production is adjusted for unutilized production capacity. The Company has started to take some costs related to the preparation and testing of phase 2.
For further information, please refer to note 3.
Borrowing costs
In accordance with IAS 23, the Company’s loan agreements are subject to the following principles relating to borrowing costs:
General and specific borrowing costs that are attributable to the acquisition, construction or production of a qualifying asset are capitalized during the period of time that is required to complete and prepare the asset for its intended use or sale. Qualifying assets are assets that necessarily take a substantial period of time to get ready for their intended use or sale.
The Company has reassessed its application of IAS 23 Borrowing cost and its effect on capitalization of borrowing cost related to financing of Indre Harøy. Application of IAS 23 has been taken into consideration where the Company has general borrowings which have partly been financing qualifying assets but not been directly allocated to the construction of a qualifying asset. Capitalization of general borrowings has been implemented retrospectively and adjustments for 2025 have been made. See note 5 for more information.
Other borrowing costs are expensed in the period in which they are incurred.
Note 2 Segment
The Company has implemented segment reporting which consists of production of farmed salmon in Norway (Farming Norway), other activities (Other), and eliminations. The segment performance is monitored to assess performance and profitability at a strategic level.
Farming Norway consists of Salmon Evolution Norway AS (grow-out facility), Salmon Evolution Dale AS (smolt facility) and Salmon Evolution Sales AS. Additionally a portion of the Group overhead costs is allocated to the segment. Other consist of both revenue and costs not attributable to the farming segment.
Sales revenue from contracts with customers comes from both Europe, UK, Asia, US and other markets. Sale of a smolt group generated 8,4 NOKm in revenues in Q4 2025 in Farming Norway.
Q4 2025
| (In thousand NOK) | Farming Norway | Other | Eliminations | Group |
|---|---|---|---|---|
| External revenue | 98 739 | 0 | 0 | 98 739 |
| Internal revenue | 0 | 11 578 | -11 578 | 0 |
| Operating revenue | 98 739 | 11 578 | -11 578 | 98 739 |
| Operational EBITDA | -1 304 | -7 127 | 0 | -8 431 |
| Operational EBIT | -17 434 | -8 217 | 474 | -25 177 |
| Fair value adjustment of biomass | 18 211 | |||
| Net financial | 8 113 | |||
| Profit/loss before tax | 1 147 | |||
| Harvested volum (tonnes, HOG) | 1 203 | 1 203 | ||
| Operational EBITDA/kg (NOK) | -1,1 | -7,0 | ||
| Operational EBIT/kg (NOK) | -14,5 | -20,9 | ||
| Total PPE | 3 644 993 | 33 459 | 38 636 | 3 717 088 |
Q4 2024
| (In thousand NOK) | Farming Norway | Other | Eliminations | Group |
|---|---|---|---|---|
| External revenue | 148 687 | 848 | 0 | 149 535 |
| Internal revenue | 0 | 7 653 | -7 653 | 0 |
| Operating revenue | 148 687 | 8 501 | -7 653 | 149 535 |
| Operational EBITDA | 15 325 | -6 077 | 0 | 9 248 |
| Operational EBIT | -3 882 | -7 883 | 474 | -11 291 |
| Fair value adjustment of biomass | -10 493 | |||
| Net financial | -5 141 | |||
| Profit/loss before tax | -26 925 | |||
| Harvested volum (tonnes, HOG) | 1 729 | 680 | ||
| Operational EBITDA/kg (NOK) | 8,9 | -10,8 | ||
| Operational EBIT/kg (NOK) | -2,2 | -37,6 | ||
| Total PPE | 2 371 935 | 33 086 | 0 | 2 405 020 |
FY 2025
| (In thousand NOK) | Farming Norway | Other | Eliminations | Group |
|---|---|---|---|---|
| External revenue | 325 250 | 772 | 0 | 326 022 |
| Internal revenue | 0 | 33 500 | -33 500 | 0 |
| Operating revenue | 325 250 | 34 272 | -33 500 | 326 022 |
| Operational EBITDA | -39 483 | -39 203 | 0 | -78 686 |
| Operational EBIT | -116 399 | -44 404 | 1 896 | -158 906 |
| Fair value adjustment of biomass | 15 630 | |||
| Net financial | -28 324 | |||
| Profit/loss before tax | -171 601 | |||
| Harvested volum (tonnes, HOG) | 4 403 | 4 403 | ||
| Operational EBITDA/kg (NOK) | -9,0 | -17,9 | ||
| Operational EBIT/kg (NOK) | -26,4 | -36,1 | ||
| Total assets | 3 644 993 | 33 459 | 38 636 | 3 717 088 |
FY 2024
| (In thousand NOK) | Farming Norway | Other | Eliminations | Group |
|---|---|---|---|---|
| External revenue | 467 742 | 3 831 | 0 | 471 573 |
| Internal revenue | 0 | 24 329 | -24 329 | 0 |
| Operating revenue | 467 742 | 28 160 | -24 329 | 471 573 |
| Operational EBITDA | 112 425 | -41 010 | 0 | 71 415 |
| Operational EBIT | 37 884 | -44 509 | 1 898 | -4 727 |
| Fair value adjustment of biomass | -10 498 | |||
| Net financial | -32 180 | |||
| Profit/loss before tax | -47 405 | |||
| Harvested volum (tonnes, HOG) | 4 891 | 4 891 | ||
| Operational EBITDA/kg (NOK) | 23,0 | 14,6 | ||
| Operational EBIT/kg (NOK) | 7,7 | -1,0 | ||
| Total assets | 2 371 935 | 33 086 | 0 | 2 405 020 |
Note 3 Biological assets and inventory
Biological assets are, in accordance with IAS 41, measured at fair value. For salmon in the grow-out facility, a present value model is applied to estimate the fair value. For roe, fry and smolt, historical cost is deemed to provide the best estimate of fair value, and hence applied.
The fair value of fish in the grow-out facility is calculated by multiplying the estimated biomass at the time of harvest with the estimated sales price at the same time and deducted for estimated costs to sell. For fish not ready for harvest, remaining production costs to grow the fish to harvest weight are deducted. The cash flow is further discounted by a discount rate considering both risk adjustment and time value.
The Company considers that fish greater than 4.6 kg is ready for harvest (about 3.8 kg gutted weight), and such fish is thus classified as harvestable fish. Fish that have not achieved this weight are classified as non-harvestable.
In the event of incident-based mortality, all costs allocated to fish affected by incident-based mortality will be deducted from the book value of the inventory.
Book value of inventory
| (in NOK thousand) | Q4 2025 | Q4 2024 |
|---|---|---|
| Equipment | 6 721 | 6 245 |
| Raw materials | 4 630 | 6 621 |
| Biological assets | 232 335 | 171 004 |
| Finished goods | 0 | 0 |
| Total | 243 687 | 183 870 |
Biological assets
| (tonnes) | Q4 2025 | Q4 2024 |
|---|---|---|
| Biological assets end of period | 3 115 | 2 023 |
Biological assets
| (in NOK thousand) | Q4 2025 | FY 2025 | Q4 2024 | FY 2024 |
|---|---|---|---|---|
| Biological assets beginning of period | 209 864 | 171 004 | 210 696 | 153 790 |
| Increase due to production | 97 273 | 411 389 | 99 263 | 371 912 |
| Reduction due to harvest/sale | -93 013 | -365 687 | -128 462 | -334 727 |
| Reduction due to incident based mortality | 0 | 0 | 0 | -9 473 |
| Fair value adjustment beginning of period | -18 810 | -21 391 | -31 884 | -31 889 |
| Fair value adjustment end of period | 37 021 | 37 021 | 21 391 | 21 391 |
| Biological assets end of period | 232 335 | 232 335 | 171 004 | 171 004 |
The estimated biomass volume is based on the actual number of individuals in the grow-out departments on the balance sheet date, adjusted for projected mortality up to harvest time and multiplied with the estimated harvest weight per individual at harvest time.
The estimated sales price for the fish in the grow-out facility is based on forward prices from Sisalmoni with relevant adjustments. The net sales value is adjusted for expected quality differences and harvesting, logistics and sales expenses.
Note 4 Property, plant, equipment, right of use- and intangible asset
Straight-line depreciation is applied over the useful life of property, plant, and equipment based on the asset’s historical cost and estimated residual value at disposal. Depreciation is charged to expense when the property, plant or equipment is ready for intended use.
| (in NOK thousand) | Intangible assets | Assets under construction | Assets in use, not allocated | Buildings and property | Fixtures and fittings | Right-of-use assets | Total |
|---|---|---|---|---|---|---|---|
| Cost 1 January 2024 | 72 350 | 70 781 | 54 019 | 1 582 996 | 310 888 | 22 163 | 2 113 198 |
| Additions | 12 184 | 391 137 | 0 | 7 987 | 9 502 | 7 623 | 428 433 |
| Reclassified constructions | 0 | 19 859 | -54 019 | 7 756 | 26 404 | 0 | 0 |
| Reclassification accornding to IFRS 16 | 0 | 0 | 0 | 0 | -4 692 | 0 | -4 692 |
| Other reclassifications | -3 398 | 0 | 0 | 0 | 0 | 3 398 | 0 |
| Cost 31 December 2024 | 81 136 | 481 778 | 0 | 1 598 740 | 342 102 | 33 185 | 2 536 940 |
| Acc. depreciation 1 January 2023 | -3 | 0 | 0 | -27 711 | -17 984 | -10 079 | -55 776 |
| Depreciation for the period | -32 | 0 | 0 | -40 366 | -30 496 | -5 249 | -76 143 |
| Net book value 31 December 2024 | 81 101 | 481 778 | 0 | 1 530 664 | 293 622 | 17 857 | 2 405 020 |
| (in NOK thousand) | Intangible assets | Assets under construction | Assets in use, not allocated | Buildings and property | Fixtures and fittings | Right-of-use assets | Total |
|---|---|---|---|---|---|---|---|
| Cost 1 January 2025 | 81 136 | 481 778 | 0 | 1 598 739 | 342 102 | 33 184 | 2 536 939 |
| Additions | 5 210 | 1 299 303 | 0 | 26 846 | 19 392 | 37 286 | 1 388 038 |
| Cost 31 December 2025 | 86 346 | 1 781 081 | 0 | 1 625 585 | 361 494 | 70 470 | 3 924 977 |
| Acc. depreciation 1 January 2024 | -34 | 0 | 0 | -68 077 | -48 480 | -15 328 | -131 919 |
| Reversal of prior-period depreciation | 0 | 0 | 0 | 0 | 4 252 | 0 | 4 252 |
| Depreciation for the period | -1 804 | 0 | 0 | -40 803 | -27 984 | -9 629 | -80 221 |
| Net book value 31 December 2025 | 84 508 | 1 781 081 | 0 | 1 516 705 | 289 282 | 45 513 | 3 717 088 |
Note 5 Finance income and finance cost
Finance Income
| (in NOK thousand) | Q4 2025 | Q4 2024 | FY2025 | FY 2024 |
|---|---|---|---|---|
| Interest income | -3 170 | 5 524 | 5 916 | 21 250 |
| Change in value of financial derivatives (gain) | 0 | 2 216 | 0 | 977 |
| Foreign exchange gains | 1 235 | 2 418 | 3 811 | 5 338 |
| Other finance income | 0 | 656 | 19 | 674 |
| Financial income | -1 935 | 10 813 | 9 746 | 28 239 |
| Share of net income from associated companies | -257 | -2 763 | -5 477 | -7 809 |
| Total financial income | -2 192 | 8 050 | 4 269 | 20 430 |
Finance cost
| (in NOK thousand) | Q4 2025 | Q4 2024 | FY2025 | FY 2024 |
|---|---|---|---|---|
| Interest on debts and borrowings | 42 970 | 13 572 | 110 508 | 53 232 |
| Capitalised borrowing costs - general borrowings | -36 741 | 0 | -36 742 | 0 |
| Capitalised borrowing costs - specific borrowings | -18 566 | 0 | -44 413 | 0 |
| Realized loss/gain on interest derivative | -1 663 | -1 503 | -6 019 | -5 966 |
| Change in value of financial derivatives (loss) | 1 307 | 0 | 3 005 | 0 |
| Foreign exchange losses | 2 421 | 1 129 | 5 340 | 4 460 |
| Other finance expenses | -33 | -6 | 914 | 884 |
| Total financial expenses | -10 305 | 13 191 | 32 593 | 52 610 |
| Net financial income/- expenses | 8 113 | -5 141 | -28 324 | -32 180 |
In the period the Company has reassessed its application of IAS 23 Borrowing cost and its effect on capitalisation of borrowing cost related to financing of Indre Harøy. Application of IAS 23 has been taken into consideration where the Company has general borrowings which has partly been.financing qualifying assets but not been directly allocated to the construction of a qualifying asset. Capitalization of general borrowings has been implemented retrospectively and adjustments for 2025 has been made (see above table). The effects on periods prior to 2025 is considered immaterial.
The Company did not have any fair value adjustments of financial liabilities in 2025, nor in 2024.
Note 6 Tax
| (in NOK thousand) | FY 2025 | FY 2024 |
|---|---|---|
| Profit/loss before tax | -171 601 | -47 405 |
| Calculated tax (22%) | -37 752 | -10 429 |
| Tax payable | 0 | 0 |
| Change in deferred tax (asset) | -37 752 | -10 429 |
| Change in deferred tax not recognised in the balance sheet | 37 752 | 10 429 |
| Tax expense | 0 | 0 |
Income tax expense is recognised based on management’s estimate of the weighted average effective annual income tax rate expected for the full financial year. The estimated average annual tax rate used for the period ended 31 December 2025 is 22%, compared to 22% for the period ended 31 December 2024.
Deferred tax benefit has not been recognised in the balance sheet as the Companies within the group are in their start-up phase and does not have any historical results to refer to when assessing whether future taxable profits will be sufficient to utilize the tax benefit.
Note 7 Earnings per share
| (in NOK thousand) | FY 2025 | FY 2024 |
|---|---|---|
| Gain/loss attributable to the equity owners of the Group | -171 601 | -47 405 |
| Gain/loss for calculation of diluted earnings per share | -171 601 | -47 405 |
| Weighted average number of shares outstanding1) | 462 603 300 | 440 297 748 |
| Dilutive options | 0 | 0 |
| Average number om shares and options used in calculation for diluted EPS | 462 603 300 | 440 297 748 |
| Basic earnings per share (NOK) | -0,37 | -0,11 |
| Diluted earnings per share (NOK) | -0,37 | -0,11 |
Basic earnings per share are based on the weighted average number of common shares outstanding during the period.
FY 2025: The Company had 462,603,300 shares for the whole period.
FY 2024: The Company had 413,963,640 shares until 18th of June, after which the number increased to 462,603,300 as a result of a private placement. Therefor the weighted average number of shares outstanding in 2024 has been calculated by applying a weight of 5.5/12 of the number of shares before the capital raise, and 6.5/12 of the total number of shares after the capital raise (462,603,300 shares).
Note 8 Share capital & capital history
| (in NOK thousand) | Date | Capital Increase | Share Capital After Change | Par Value | Subscription price per share | New shares | Total no. of outstanding shares |
|---|---|---|---|---|---|---|---|
| Opening balance 1 July 2020 | 5 375 159 | 0,05 | 107 503 182 | ||||
| Share options exercised | 10 July 2020 | 30 000 | 5 405 159 | 0,05 | 3,33 | 600 000 | 108 103 182 |
| Private placement | 23 July 2020 | 581 395 | 5 986 554 | 0,05 | 4,30 | 11 627 906 | 119 731 088 |
| Private placement | 11 September 2020 | 5 000 000 | 10 986 554 | 0,05 | 5,00 | 100 000 000 | 219 731 088 |
| Private placement | 23 March 2021 | 4 166 667 | 15 153 221 | 0,05 | 6,00 | 83 333 333 | 303 064 421 |
| Acquisition Kraft Laks | 16 August 2021 | 109 535 | 15 262 756 | 0,05 | 7,58 | 2 190 694 | 305 255 115 |
| Private placement | 12 October 2021 | 277 068 | 15 539 824 | 0,05 | 7,71 | 5 541 374 | 310 796 489 |
| Share options exercised | 26 March 2022 | 81 250 | 15 621 074 | 0,05 | 4,80 | 1 625 000 | 312 421 489 |
| Private placement | 5 April 2022 | 1 666 667 | 17 287 741 | 0,05 | 9,00 | 33 333 333 | 345 754 822 |
| Private placement | 18 April 2023 | 3 409 091 | 20 696 832 | 0,05 | 7,70 | 68 181 818 | 413 936 640 |
| Private placement | 18 June 2024 | 2 433 333 | 23 130 165 | 0,05 | 7,50 | 48 666 660 | 462 603 300 |
The Company entered into an investment agreement with Dongwon Industries and completed a NOK 50 million in towards Dongwon Industries in July 2020.
The Company raised NOK 500 million in a private placement in connection with its initial public offering related to the admission on Merkur Market (now Oslo Børs) in September 2020. Further, the Company also raised another NOK 500 million in a private placement in March 2021.
In August 2021 the Company acquired 100% of the shares in Kraft Laks AS. As part of the settlement the Company issued 2,190,694 new shares of NOK 7.6 per share and thereby increased its equity by NOK 16.6 million. In October 2021 the Company carried out a private placement of USD 5m (NOK ~43m) towards Cargill.
Further, in April 2022 the Company carried out a private placement raising gross proceeds of NOK 300 million at a subscription price of NOK 9.0 per share.
In April 2023 the Company carried out a private placement raising gross proceed of NOK 525 million at a subscription price of NOK 7.7 per share.
In June 2024 the Company carried out a private placement raising gross proceed of NOK 365 million at a subscription price of NOK 7.5 per share.
Note 9 Interest bearing debt
Long-term interest bearing dept
| (in NOK thousand) | 31.12.2025 | 31.12.2024 |
|---|---|---|
| Debt to credit institutions | 1 545 228 | 569 100 |
| Leasing liabilities | 30 088 | 9 668 |
| Total long-term interest-bearing debt | 1 575 316 | 578 768 |
Short-term interes bearing dept
| (in NOK thousand) | 31.12.2025 | 31.12.2024 |
|---|---|---|
| Debt to credit institutions | 334 571 | 158 488 |
| Other short-term interest bearing debt | 0 | 0 |
| Leasing liabilitites | 10 987 | 5 317 |
| Total short-term interest-bearing debt | 345 558 | 163 805 |
| Total interest-bearing debt | 1 920 874 | 742 573 |
| Cash & cash equivalents | 163 438 | 429 462 |
| Net interest-bearing debt | 1 757 437 | 313 111 |
In June 2024 the Company expanded its existing senior secured debt financing package related to Indre Harøy Phase 1 and 2, from 1,550 NOKm to 2,225 NOKm. In June 2025 the Company entered credit facility of up to 250 NOKm with DNB and Nordea Bank to strengthen the Company’s financial flexibility. This facility was amended during the quarter, and the entire facility is available to support operations at Indre Harøy and ongoing phase 2 investments. Simultaneously in in June, the Company also increased its overdraft facility in connection with the Indre Harøy operation from 150 NOKm to 200 NOKm.
As per 31 December 2025, 1,527 NOKm was drawn of the secured green debt financing package. In addition, the Company has drawn 198 NOKm, of the 200 NOKm available under the Overdraft Facility.
The Company has also entered into loan agreements for a total of NOK 60 million relating to Salmon Evolution Dale AS of which around NOK 49 million was drawn as per 31 December 2025. This loan is for financing of working capital, investments in Salmon Evolution Dale as well as refinancing of the seller’s credit from the acquisition of Salmon Evolution Dale AS. For 2025 the above table does not include other long-term liabilities of NOK 3.6 million related to water rights in Salmon Evolution Dale AS.
The loans are floating interest rate loans denominated in NOK with an interest charge based on NIBOR 3M plus an agreed margin.
Financial covenants
The most important financial covenants for the long-term financing of the Company are, respectively, a solvency requirement that the borrower’s (Salmon Evolution Norway AS) book equity ratio (including intra-group loans) shall be minimum 45%. Further, there is a profitability requirement linked to the borrower’s EBITDA which shall be greater than NOK 250 million on a last 12-month basis from Q2 2027. Quarterly EBITDA figures were measured from Q2 2024 with set minimum EBITDA levels reflecting the Company’s gradual ramp up of production volumes and profitability.
Finally, there is a minimum cash requirement that stipulates that the obligors (Salmon Evolution Norway AS, Salmon Evolution Sales AS and Salmon Evolution ASA) cash balance shall be greater than NOK 100 million at any time. Any undrawn and available amounts under the revolving facility and the overdraft is included in the calculation of the cash balance.
Security
The Company’s bank debt facilities are fully guaranteed by Salmon Evolution ASA. The respective lenders also have a pledge over 100% of the shares in the borrower, Salmon Evolution Norway AS and Salmon Evolution Dale AS. Furthermore, the respective lenders have a pledge over all material operating assets of the Company, hereunder inter alia, land, plant and machinery, operating licenses, inventory and receivables.
Cash movements in financial activities
(NOK thousand) | Short term | Long term |
|---|---|---|
| Balance at January 1, 2024 | 107 625 | 586 859 |
| Repayment of loans and borrowings | 0 | -869 |
| Proceeds from new bank loan | 55 213 | 0 |
| Obligations due to land and water rights | 0 | -5 059 |
| Change in leases liabilities | 968 | 1 480 |
| Balance at December 31, 2024 | 163 806 | 582 411 |
| Balance at January 1, 2025 | 163 805 | 582 411 |
| Repayment of loans and borrowings | -300 | -900 |
| Proceeds from new bank loan | 176 383 | 977 028 |
| Change in leases liabilities | 5 670 | 20 420 |
| Balance at December 31, 2025 | 345 558 | 1 578 959 |
Note 10 Transactions with related parties
During the ordinary course of business, the Company may engage in certain arm’s length transactions with related parties.
There were no material transactions with related parties in 2025.
Note 11 Subsequent events
No material subsequent events.
ABOUT SALMON EVOLUTION
Salmon Evolution is the global leader within land-based salmon farming. Pioneering the hybrid flow-through system (HFS), Salmon Evolution is Extending the Ocean Potential by creating optimal growth conditions in a controlled environment on land. This approach, capturing the benefits of both land-based and sea-based farming, puts biology first and limits operational and biological risk.
Salmon Evolution is strategically located the heart of the global aquaculture industry on the west coast of Norway, where the Company has its first facility and global centre of excellence fully operational at industrial scale. Enabled by proof of concept in at Indre Harøy, Salmon Evolution targets significant expansion.
Salmon Evolution is listed on Oslo Børs under the ticker SALME. To learn more, please visit www.salmonevolution.no.
OFFICE ADDRESS
Torget 5, 6440 Elnesvågen (HQ)
Keiser Wilhelms gate 22, 6003 Ålesund
PRODUCTION SITES
Grow-out: Indre Harøyvegen 88, 6430 Bud
Smolt: Dalsfjordvegen 2805, 6120 Folkestad
ORG NUMBER
NO 925 344 877 MVA
E-mail: post@salmone.no
Web: salmonevolution.no
| BOARD OF DIRECTORS | MANAGEMENT |
|---|---|
| Tore Tønseth Chairman of the Board | Trond Håkon Schaug-Pettersen CEO |
| Anne Breiby Board Member | Trond Vadset Veibust CFO |
| Ingvild Vartdal Board Member | Ingjarl Skarvøy COO |
| Peder Stette Board Member | Odd Frode Roaldsnes CCO |
| Eunhong Min Board Member | Kamilla Mordal Holo CPO |
| Jan-Emil Johannessen Board Member | Vidar Skjørli HR Director |
| Vibecke Bondø Board Member |