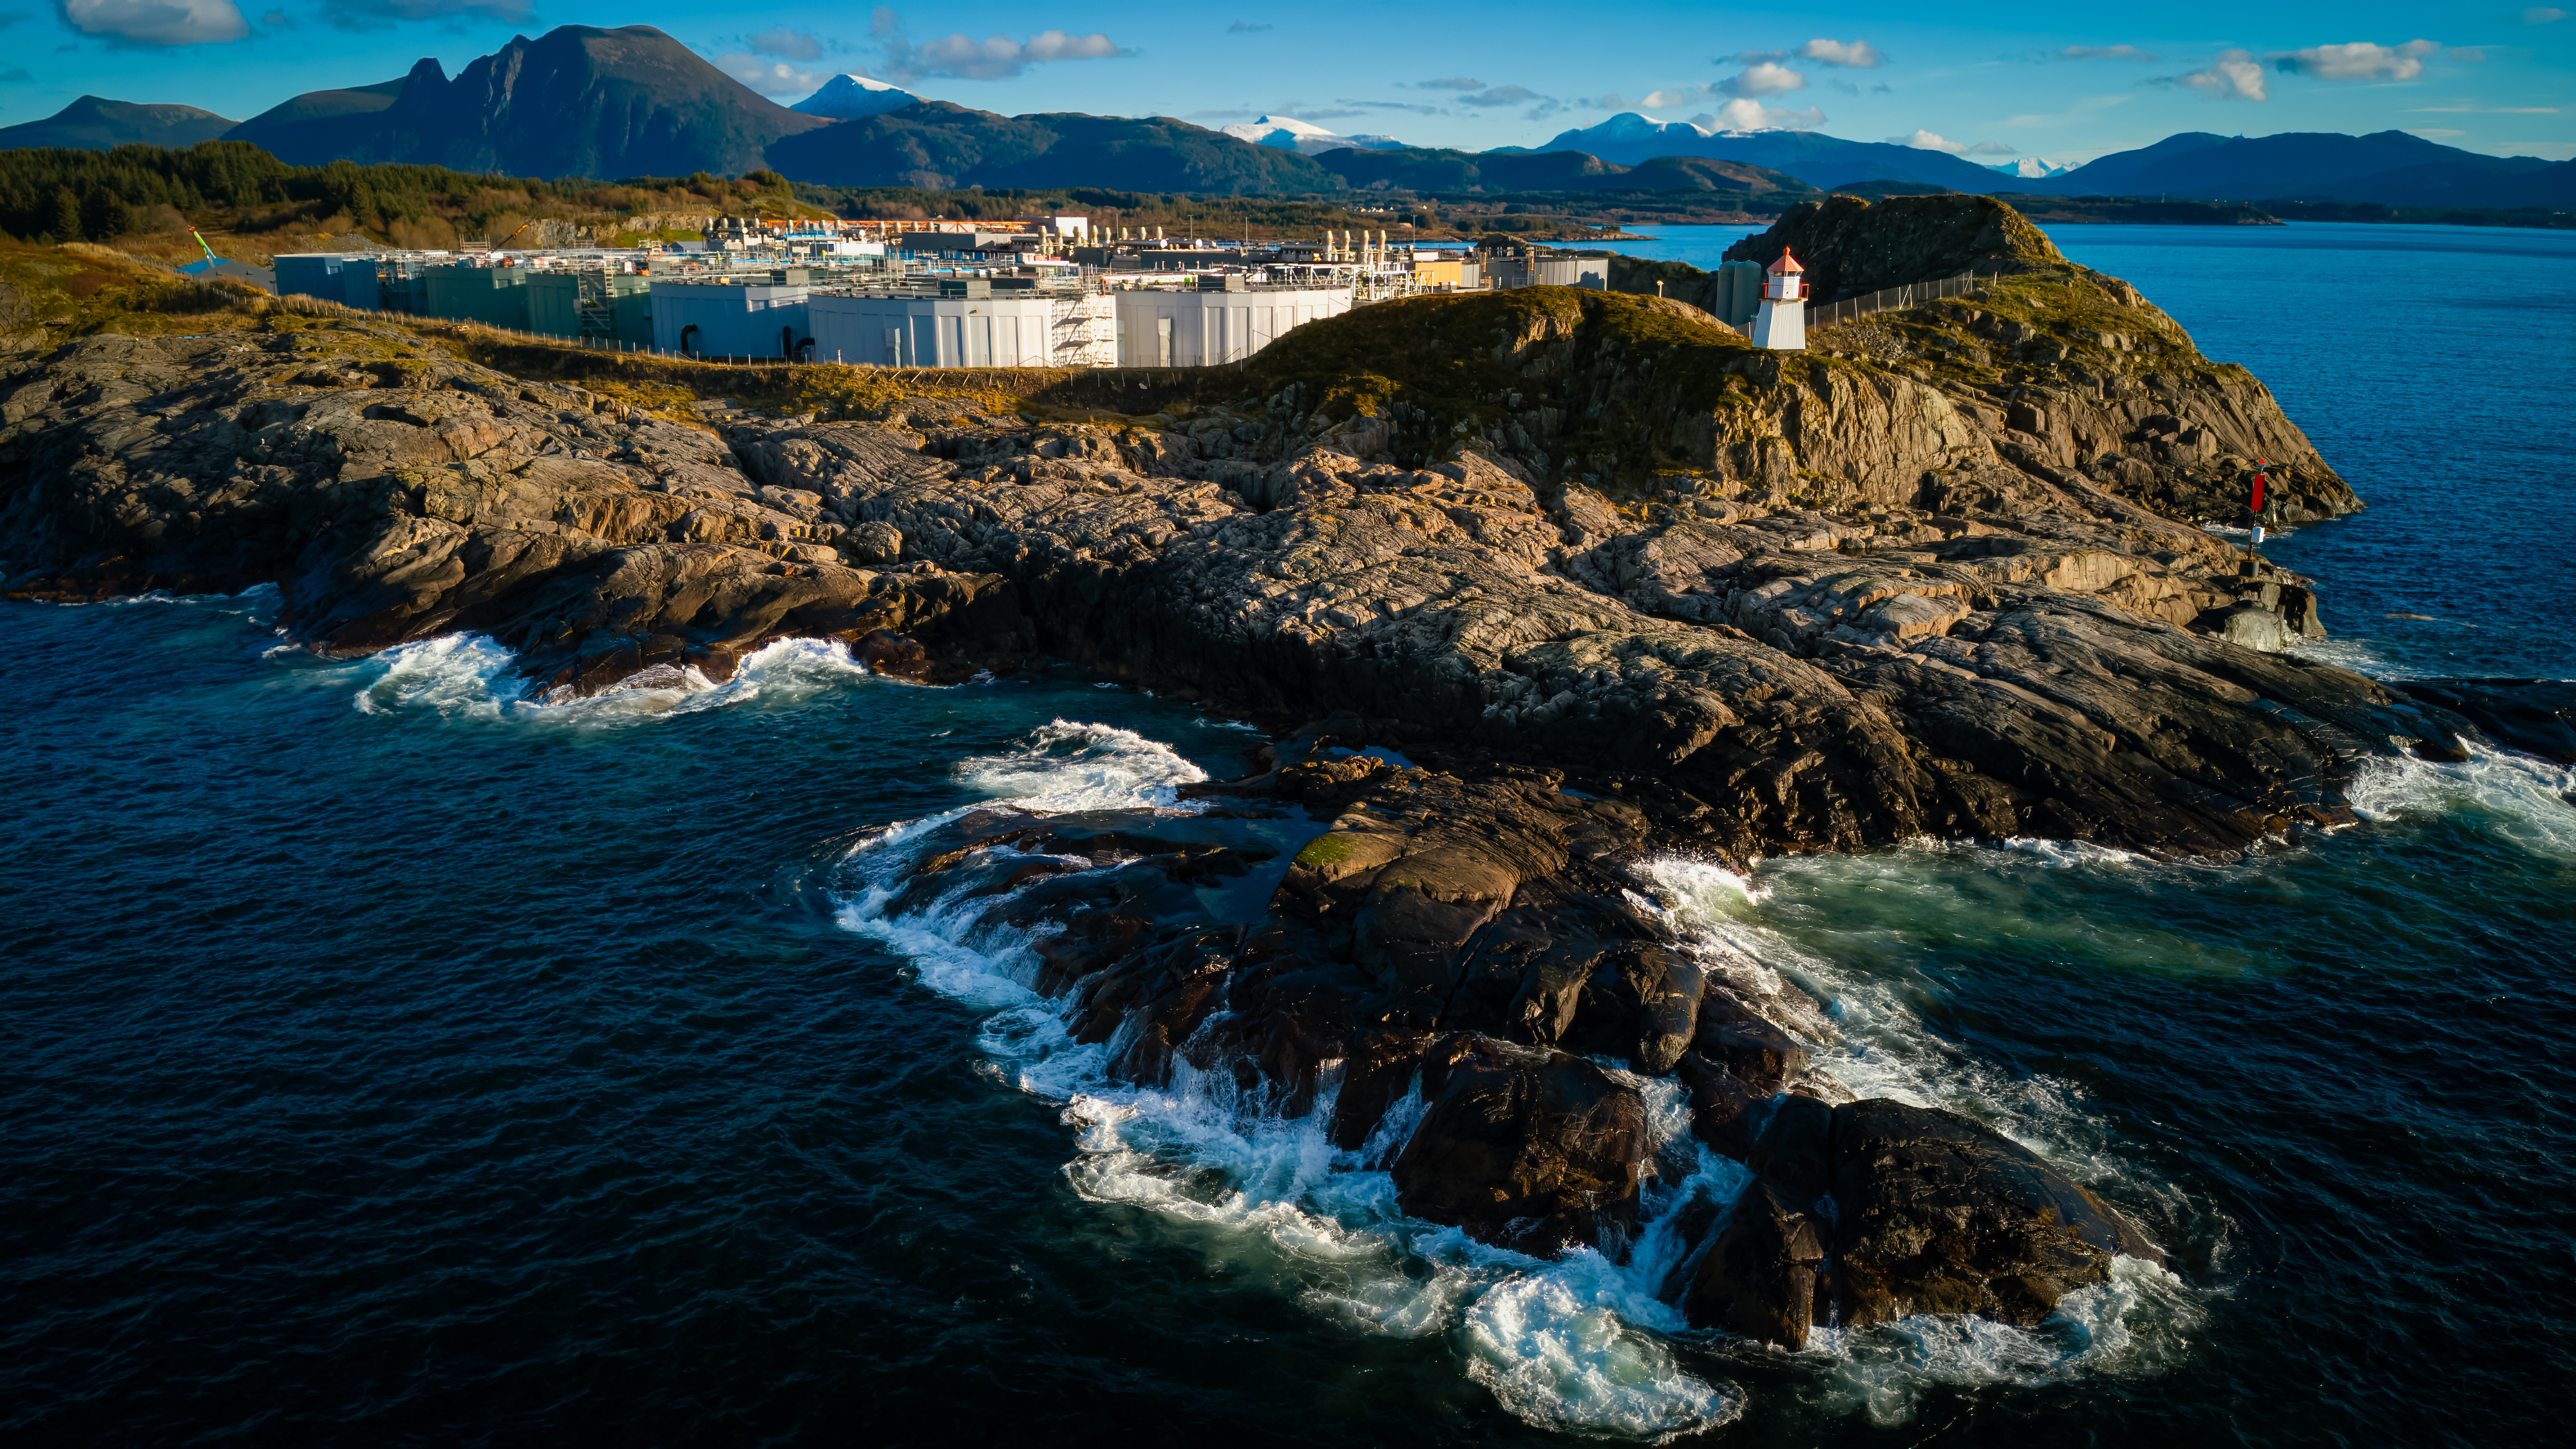

Financial statements and results
Group consolidated financial statements (IFRS)
Consolidated statement of profit or loss
| (NOK thousands) | Note | 2025 Consolidated | 2024 Consolidated |
|---|---|---|---|
| Sales revenues from farming | 4,5 | 325,250 | 467,742 |
| Other income | 4,5 | 772 | 3,831 |
| Total operating revenue | 326,022 | 471,573 | |
| Change in inventory | 6,7 | 43,711 | 29,603 |
| Cost of materials | 7 | -203,064 | -200,933 |
| Personnel Expenses | 8,9 | -80,998 | -68,046 |
| Other Operating expenses | 8,10 | -164,357 | -160,781 |
| Operational EBITDA | -78,686 | 71,415 | |
| Depreciations | 11 | -80,221 | -76,142 |
| Operational EBIT | -158,906 | -4,727 | |
| Fair value adjustment of biomass | 6 | 15,630 | -10,498 |
| Operating Profit (EBIT) | -143,276 | -15,225 | |
| Financial income | 12 | 9,746 | 28,239 |
| Financial expense | 12 | -32,593 | -52,610 |
| Share of net income from associated companies | 13 | -5,478 | -7,809 |
| Net financial | -28,324 | -32,180 | |
| Profit/loss before tax | -171,601 | -47,405 | |
| Income tax expense | 14 | 0 | 0 |
| Profit/loss for the period | -171,601 | -47,405 | |
| Basic earnings per share (NOK) | 15 | -0.37 | -0.11 |
| Diluted earnings per share (NOK) | 15 | -0.37 | -0.11 |
Consolidated statement of comprehensive income
| NOK thousands | Note | 2025 Consolidated | 2024 Consolidated |
|---|---|---|---|
| Profit/loss for the period | -171,601 | -47,405 | |
| Items that are or may be reclassified to profit or loss: | |||
| Currency translation differences | 13 | 862 | -178 |
| Total comprehensive income for the period, net of tax | -170,738 | -47,584 |
Consolidated statement of financial position
| (NOK thousands) | Note | 31 Dec 2025 Consolidated | 31 Dec 2024 Consolidated |
|---|---|---|---|
| Assets | |||
| Intangible assets | 11,16 | 84,508 | 81,101 |
| Assets under construction | 11 | 1,781,081 | 481,778 |
| Property, plant & equipment | 11 | 1,805,987 | 1,824,284 |
| Right-of-use assets | 17 | 45,513 | 17,857 |
| Investments in associated companies | 13 | 6,073 | 10,689 |
| Other long-term receivables | 24 | 13,169 | 0 |
| Total non-current assets | 3,736,330 | 2,415,709 | |
| Inventory | 6 | 11,351 | 12,866 |
| Biological assets | 6 | 232,335 | 171,004 |
| Trade receivables | 3 | 10,314 | 90,522 |
| Other current receivables | 18 | 51,585 | 51,142 |
| Financial derivatives | 3,19 | 10,254 | 13,643 |
| Cash and cash equivalents | 3,20 | 163,438 | 429,462 |
| Total current assets | 479,276 | 768,639 | |
| Total assets | 4,215,607 | 3,184,348 | |
| Equity and liabilities | |||
| Share capital | 21 | 23,130 | 23,130 |
| Share premium | 21 | 2,414,997 | 2,415,049 |
| Other reserves | 9,21 | 13,310 | 11,483 |
| Uncovered losses | -388,765 | -226,402 | |
| Total equity | 2,062,673 | 2,223,260 | |
| Long-term interest-bearing debt | 3,22 | 1,545,228 | 569,100 |
| Lease liabilities - long term | 3,17,22 | 30,088 | 9,668 |
| Other long term liabilites | 22 | 3,643 | 3,643 |
| Total non-current liabilities | 1,578,959 | 582,411 | |
| Short-term interest-bearing debt | 3,22 | 334,571 | 158,488 |
| Trade payables | 3,23,24 | 192,047 | 193,384 |
| Social security and other taxes | 23 | 7,527 | 7,080 |
| Lease liabilities - short term | 3,17,22 | 10,987 | 5,317 |
| Other short-term liabilities | 23 | 28,842 | 14,408 |
| Total current liabilities | 573,975 | 378,677 | |
| Total liabilities | 2,152,934 | 961,088 | |
| Total equity and liabilities | 4,215,607 | 3,184,348 |
The Board of Directors of Salmon Evolution ASA
Elnesvågen/Ålesund 27 April 2026
Tore Tønseth
Chair
Peder Stette
Director
Anne Breiby
Director
Ingvild Vartdal
Director
Vibecke Bondø
Director
Jan-Emil Johannessen
Director
Eunhong Min
Director
Trond Håkon Schaug-Pettersen
CEO
Consolidated statement of cash flows
| (NOK thousands) | Note | 2025 Consolidated | 2024 Consolidated |
|---|---|---|---|
| Cash flows from operating activities | |||
| Profit/loss for the period | -171,601 | -47,405 | |
| Adjustments for: | |||
| Depreciation, amortisation and impairment loss | 11 | 84,473 | 76,142 |
| Net financials | 12 | 28,324 | 32,180 |
| Share based payment expenses | 9 | -1,827 | 726 |
| Changes in working capital: | |||
| Change in trade receivables | 67,598 | -50,026 | |
| Change in other current receivables | 18 | -2,946 | -11,073 |
| Change in inventory and biological assets | 6 | -41,438 | -32,209 |
| Change in fair value of biomass | 6 | -15,630 | 10,498 |
| Change in trade payables | 23 | -4,937 | 65,583 |
| Change in social security and other taxes | 23 | 442 | -779 |
| Change in other current liabilities | 23 | -1,511 | -306 |
| Cash (outflow) from operating activities | -59,052 | 43,331 | |
| Cash flow from investment activities | |||
| Payments for fixed assets | 11,16 | -1,260,474 | -358,584 |
| Proceeds from government grants | 11,16 | 2,258 | 764 |
| Payments for intangible assets | 11 | -3,960 | -12,176 |
| Financial income received | 12 | 9,746 | 27,434 |
| Net cash (outflow) from investment activities | -1,252,431 | -342,562 | |
| Cash flow from financing activities | |||
| Proceeds from issue of equity | 21 | 0 | 365,000 |
| Transaction costs | 21 | 0 | -15,575 |
| Proceeds from new borrowings | 3,22 | 1,153,412 | 50,185 |
| Repayment of borrowings | 3,22 | -1,200 | -900 |
| Payments of principal portion of lease liabilities | 17 | -12,173 | -5,354 |
| Interest paid lease liabilities | 17 | -2,503 | -941 |
| Financial expenses paid | 12 | -92,078 | -50,118 |
| Net cash (outflow) from financing activities | 1,045,458 | 342,297 | |
| Net change in cash and cash equivalents | -266,024 | 43,066 | |
| Cash and cash equivalents at the beginning of the period | 20 | 429,462 | 386,396 |
| Cash and cash equivalents at the end of the period | 20 | 163,438 | 429,462 |
Consolidated statement of changes in equity
| (NOK thousands) | Share capital | Share premium | Other reserves | Uncovered losses | Total equity | |
|---|---|---|---|---|---|---|
| Balance at 1 January 2024 | 10 | 20,697 | 2,124,647 | 10,758 | -235,408 | 1,920,693 |
| Profit/loss for the period | 0 | 0 | 0 | -47,405 | -47,405 | |
| Other comprehensive income | 0 | 0 | 0 | -178 | -178 | |
| Total comprehensive income | 0 | 0 | 0 | -47,584 | -47,584 | |
| Private placement June 2024 | 2,433 | 362,567 | 0 | 0 | 365,000 | |
| Private placement, transaction costs | 0 | -15,575 | 0 | 0 | -15,575 | |
| Reclassification uncovered losses | 0 | -56,590 | 0 | 56,590 | 0 | |
| Share based payment expensed | 0 | 0 | 726 | 0 | 726 | |
| Transactions with owners | 2,433 | 290,402 | 726 | 56,590 | 350,151 | |
| Balance at 31 December 2024 | 10 | 23,130 | 2,415,049 | 11,483 | -226,402 | 2,223,260 |
| Balance at 1 January 2025 | 10 | 23,130 | 2,415,049 | 11,483 | -226,402 | 2,223,260 |
| Profit/loss for the period | 0 | 0 | 0 | -171,601 | -171,601 | |
| Other comprehensive income | 0 | 0 | 0 | 862 | 862 | |
| Total comprehensive income | 0 | 0 | 0 | -170,738 | -170,738 | |
| Other change | 0 | 0 | 0 | 8,377 | 8,377 | |
| Other paid-in capital | 0 | -51 | 0 | 0 | -51 | |
| Share based payment expensed | 0 | 0 | 1,827 | 0 | 1,827 | |
| Transactions with owners | 0 | -51 | 1,827 | 8,377 | 10,152 | |
| Balance at 31 December 2025 | 10 | 23,130 | 2,414,997 | 13,310 | -388,765 | 2,062,673 |
Notes
Note 1 Summary of significant accounting policies
General information
Salmon Evolution ASA is a Norwegian public limited liability company listed on Oslo Stock Exchange. Salmon Evolution ASA and its subsidiaries, Salmon Evolution Norway AS, Salmon Evolution International AS, Salmon Evolution Dale AS, Salmon Evolution Technology AS and Salmon Evolution Sales AS (the “Company”, “SE” or “the Group”) is a Norwegian business headquartered in Hustadvika kommune in Møre og Romsdal. SE is building a land-based salmon farming facility at Indre Harøy, with a planned annual production of 36,000 tons HOG fully developed of which phase 1 has a planned annual production of 7,900 tons HOG.
The build-out consists of three phases, with the first phase consisting of 12 large grow out tanks with corresponding infrastructure. SE will operate a hybrid flow-through (HFS) system, utilizing fresh seawater from the Norwegian coast. Construction start of phase 1 was in Q2 2020 and was completed mid-April 2023. The first smolt batch was released at Indre Harøy late March 2022 as per original timeline, and the Group completed its first harvest in November 2022. Phase 2 consists of build out of an additional 12 grow out tanks with first smolt expected H1 2026. The last construction phase, phase 3, consists of build-out of an additional 24 grow out tanks.
Consolidation
These consolidated statements for the period ended 31 December 2025 include Salmon Evolution ASA together with its subsidiaries Salmon Evolution Norway AS, Salmon Evolution International AS, Salmon Evolution Sales AS, Salmon Evolution Technology AS and Salmon Evolution Dale AS.
Consolidation principles
Subsidiaries are all entities over which the Group has control. The Group controls an investee if all three of the following elements are present: power over the investee, exposure to variable returns from the investee, and the ability of the investor to use its power to affect those variable returns. Consolidation of a subsidiary begins when the Group obtains control over the subsidiary and ceases when the Group loses control of the subsidiary. The accompanying consolidated financial statements include the accounts of the subsidiaries mentioned above. When necessary, adjustments are made to the local financial statements of the Group subsidiaries to conform with the consolidated Group’s accounting policies presented under IFRS. All intercompany balances, transactions, and unrealized gains from intercompany transactions are eliminated upon consolidation. Unrealized losses from intercompany transactions are also eliminated upon consolidation unless the transaction provides evidence of impairment of the transferred asset. The assets, liabilities, income, and expenses of a subsidiary acquired or disposed of during the year are included in the consolidated financial statements from the date in which the Group gains control until the date in which the Group ceases to control the subsidiary.
Basis of preparation
The consolidated financial statements of the Group for the year ended 31 December 2025, and are prepared in accordance with IFRS® Accounting Standards as adopted by the EU. The consolidated financial statements ended 31 December 2025 comprise the income statement, statement of comprehensive income, statement of financial position, statement of cash flow, statement of changes in equity and note disclosures.
Going concern
The Group has prepared the consolidated financial statement on a going concern basis. When assessing this assumption, management has assessed all available information about the future. After making such assessments, management has a reasonable expectation that the Group has adequate resources to continue its operational existence for the foreseeable future.
Accounting policies
Adoption of new and revised standards
There are no new standards that have been applied in 2025 with significant effect on the financial statements.
The IASB has issued IFRS 18 Presentation and Disclosure in Financial Statements, which replaces IAS 1 and introduces new requirements for the presentation of financial performance and enhanced disclosures. IFRS 18 is effective for annual reporting periods beginning on or after 1 January 2027 and is required to be applied retrospectively (with restatement of comparative information). The Group is currently assessing the impact of IFRS 18 and expects the main effects to relate to presentation and disclosure in the primary financial statements and notes; the standard is not expected to impact recognition and measurement.
Basis of measurement
The financial statements have been prepared on historical cost basis, except for the following items:
- Financial derivatives, measured at fair value through profit or loss.
- Biological assets, measured at fair value through profit or loss.
Use of estimates
Critical accounting judgments and estimates are disclosed in note 2.
Functional and presentation currency
Items included in the financial statements are presented in the currency of the primary economic environment in which the entity operates (“the functional currency”). The financial statements are presented in Norwegian kroner (NOK), which is the Parent company, and substantial subsidiaries, functional and presentation currency.
Transactions and balances
Transactions in currencies other than the entity's functional currency (foreign currency) are translated into the functional currency using the exchange rates at the dates of the transactions.
Foreign exchange gains and losses resulting from the settlement of such transactions and from the translation of monetary assets and liabilities denominated in foreign currencies at year end exchange rates are generally recognized in profit or loss. Currency translation differences related to the valuation of investments in associates are recognised in Other comprehensive income. All other foreign exchange gains and losses are presented in the statement of profit or loss on a net basis within other financial items. Translation differences on assets and liabilities carried at fair value are reported as part of the fair value gain or loss. Non-monetary items that are measured in terms of historical cost in a foreign currency are not subsequently revaluated.
Revenue
Revenue from contracts with customers as defined in IFRS 15 is recognised when control of the goods are transferred to the customer at an amount that reflects the consideration to which the group expects to be entitled in exchange for those goods.
Revenue for the Group derives both from the sale of smolt from contract with customers and sale of whole and processed salmon in the spot marked. It has not been made any forward sales contracts. The Group recognised revenue at the point in time when control of the goods is transferred to the customer at an amount that reflects the expected amount that the group is entitled to have for the goods. The sales price is based on available market price where the price will vary with both quality and size.
Normal credit terms of the sales transactions are 30 days. If the delivered products have discrepancies compared to the agreed sales contract, cash refunds are given to the customer. Up until now, refunds are not material.
Government grants
Government grants are recognized when there is reasonable assurance that the grant will be received and when the Group is compliant with all conditions attached. When the grant relates to an expense item, it is recognized as income over the period that the costs it is intended to compensate are expensed. When the grant relates to an asset, it is deducted from the carrying amount of the asset - the grant is then recognized in profit or loss over the useful life of a depreciable asset by way of a reduced depreciation charge. Government grants are presented in the accompanying statements of profit and loss as other income. See note 16 for further details.
Employee benefits
Liabilities for wages and salaries, including equity settled share based payments, non-monetary benefits, annual leave and accumulating sick leave that are expected to be settled wholly within 12 months after the end of the period in which the employees render the related service are recognised in respect of employees’ services up to the end of the reporting period and are measured at the amounts expected to be paid when the liabilities are settled. The liabilities are presented as current employee benefit obligations in the balance sheet.
Share based payments
The fair value of options granted under the scheme is recognised as an employee benefits expense with a corresponding increase in equity. The total amount to be expensed is determined by reference to the fair value of the options granted:
- including any market performance conditions (e.g. the entity’s share price)
- excluding the impact of any service and non-market performance vesting conditions (e.g. profitability, sales growth targets and remaining an employee of the entity over a specified period), and
- including the impact of any non-vesting conditions (e.g. the requirement for employees to save or hold shares for a specific period).
Total fair value is expensed over the vesting period, which is the period in which all the specified vesting conditions are to be satisfied. At the end of each period, the entity revises its estimates of the number of options that are expected to vest based on the non-market vesting and service conditions. It recognises the impact of the revision to original estimates, if any, in profit or loss, with a corresponding adjustment to equity.
Information relating to the Group’s employee stock option scheme is set out in note 9.
Current and change in deferred tax for the year
Income Tax
The tax expense represents the sum of the tax currently payable and change in deferred tax.
Deferred tax
Deferred tax is the tax expected to be payable or recoverable on differences between the carrying amounts of assets and liabilities in the financial statements and the corresponding tax bases used in the computation of taxable profit and is accounted for using the balance sheet liability method. Deferred tax liabilities are generally recognized for all taxable temporary differences and deferred tax assets are recognized to the extent that it is probable that taxable profits will be available against which deductible temporary differences can be utilized.
Current tax and deferred tax for the year
Current and deferred tax are recognized in profit or loss, except when they relate to items that are recognized in other comprehensive income or directly in equity, in which case, the current and deferred tax are also recognized in other comprehensive income or directly in equity respectively.
Deferred tax benefit has not been recognised in the balance sheet as the Group is in its start-up phase and does not have any historical results to refer to when assessing whether future taxable profits will be sufficient to utilize the tax benefit.
Leases
The Group assesses whether a legally enforceable contract is or contains a lease at the inception date of the contract. The assessment includes several criteria to be determined based on judgment that includes whether there is an identifiable asset in connection to the lease, whether the Group has the right to control the use of the identifiable asset, and whether the Group can obtain substantially all economic benefits from the identifiable asset.
The Group recognizes a right-of-use (“ROU”) asset and a lease liability at the lease commencement date. The lease liability is calculated based on the present value of the contractual minimum lease payments using the incremental interest rate of the lease. The contractual minimum lease payments consist of fixed payments based on contractual amount at the time of conclusion of the agreement. The lease liability is subsequently measured at amortized cost under the effective interest rate during the lease term and may also be adjusted to management’s reassessment of future lease payments based on options exercised renegotiations, or changes of an index rate.
The ROU asset is calculated based on the lease liability, plus initial direct costs towards the lease, and less any incentives granted by the lessor. The ROU asset is subsequently amortized under the straight-line method under the shorter of the lease term or the useful life of the underlying asset and is included as part of depreciation and amortization in the accompanying statements of other comprehensive income.
Leases that fall under the IFRS 16 short-term exception are recognized on a straight-line basis over the lease term.
Financial instruments
A financial instrument is any contract that gives rise to a financial asset for one entity and a financial liability or equity instrument for another entity.
Interest rate swap
The Group has entered interest rate swap to hedge its risk exposure to interest-bearing debt. Changes in fair value of those derivates are recognized as unrealized profit/loss under financial income/loss and allocated to, an unrealized profit/loss as other current receivables in the balance sheet.
Currency hedging
Salmon Evolution Sales AS make use of forward currency contracts to hedge against fluctuations in exchange rates that arise during the period between when Salmon Evolution Sales enters a sales contract and when the product is paid for. Changes in fair value of those contracts are recognized as unrealized profit/loss under financial income/loss and to other current receivables in the balance sheet.
Cash and cash equivalents
For the purpose of presentation in the statement of cash flows, cash and cash equivalents include cash on hand and deposits held at call with financial institutions.
Trade receivables, loans and other receivables
Trade receivables, loans and other receivables are recognized at invoiced amounts and subsequently measured at amortized cost using the effective interest method, less provision for impairment. See notes 3, 17, 18 and 22 for further information about the Group’s accounting for trade receivables, loans, other receivables and credit risk.
Property, plant and equipment
Property, plant, and equipment are measured at cost, which includes capitalized borrowing costs, less accumulated depreciation and costs include expenditures that are directly attributable to the acquisition and placement of fixed assets in service. Costs of major replacements and renewals that substantially extend the economic life and functionality of fixed assets are capitalized. Costs associated with normal maintenance and repairs are expensed as they are incurred.
Assets are normally considered property, plant, and equipment if the useful economic life exceeds one year. Straight-line depreciation is applied over the useful life of property, plant, and equipment based on the asset’s historical cost. If a substantial part of an asset has an individual and different useful life, that portion is depreciated separately. The asset’s residual value and useful life are evaluated annually. Gains or losses arising from the disposal or retirement of an asset are determined as the difference between the sales proceeds and the carrying amount of the asset and recognized as part of other income in the accompanying statements of other comprehensive income.
Depreciaton is charged to expense when the property, plant or equipment is ready for intented use. The group considered the test- and verification phase for first phase of its Indre Harøy facility ready for intended use from April 2023, and started depreciations from that time. For the second phase build out, which expected to be ready for intended use during 2026, assets under construction is not depreciated.
Intangible assets
Expenses related to research activities are expensed as incurred. Expenses related to development activities are capitalized if the product or process is technically and commercially feasible, and the Group has adequate resources to complete the development.
Patents are capitalized and measured at cost less accumulated amortization and any accumulated impairment losses, if any.
Goodwill
When the Group assumes control over a separate business entity for a consideration that exceeds the fair value of the individual assets and liabilities assumed, the difference is entered as goodwill in the statement of financial position. Goodwill is not depreciated but is tested for impairment annually if there are indications that its value is lower than the carrying amount. See note 11 for further information.
Impairment
Management reviews long-lived assets for impairment annually, or more frequently, whenever events or changes in circumstances indicate that the carrying value may not be recoverable. The recoverable amount is the higher of an asset’s fair value, less costs of disposal and value in use. When such assets are identified, with certain indicators, an impairment test will be carried out.
If an evaluation is required, the estimated future undiscounted cash flows associated with the assets are compared to the asset’s carrying value to determine if an adjustment for impairment to such asset is necessary. The effect of any impairment would be to expense the difference between the fair value of such assets and their carrying value. Non-financial assets that suffered impairment are reviewed for possible reversal of the impairment at the end of each reporting period.
See note 11 for further description.
Biological assets
Biological assets are, in accordance with IAS 41, measured at fair value. For salmon in the grow-out facility, a present value model is applied to estimate the fair value. For roe, fry and smolt, historical cost is deemed to provide the best estimate of fair value, and hence applied. For further information, please refer to note 6.
Classification of current and non-current items
Assets are classified as current when they are expected to be realized or sold, or to be used in the Group's normal operating cycle or falls due or is expected to be realized within 12 months after the end of the reporting date. Assets that do not fall under this definition are classified as non-current. Liabilities are classified as current when they are expected to be settled in the normal operating cycle of the Group or are expected to be settled within 12 months after the reporting date, or if the Group does not have an unconditional right to postpone settlement for at least 12 months after the reporting date. Liabilities that do not fall under this definition are classified as non-current.
Trade and Other Receivables
Trade receivables are initially recognized at amortized cost, less a provision for expected credit losses. Credit loss provisions are based on individual customer assessments over each reporting period and not on a 12-month period.
The Group has procedures to ensure that products are only sold to customers with satisfactory creditworthiness, where credit insurance is used when deemed necessary. This risk is, per 31.12.2025, not considered to be material.
In 2025, except for some sale of smolt and post-smolt to extern customers, all produced fish was mainly sold to Salmon Evolution Sales AS, which in turn sold it to external customers. The sales company secures the bulk of its sales through credit insurance.
Borrowings
Borrowings are initially recognized at fair value, net of transaction costs incurred. Borrowings are subsequently measured at amortised cost. Any difference between the proceeds (net of transaction costs) and the redemption amount is recognised in profit or loss over the period of the borrowings using the effective interest method. Borrowings are derecognised when the obligation specified in the contract is discharged, cancelled or expired. The difference between the carrying amount of a financial liability that has been extinguished or transferred to another party and the consideration paid, including any non-cash assets transferred or liabilities assumed, is recognised in consolidated statement of profit or loss within the line other financial items, net.
Borrowings are classified as current liabilities unless the Group has a right to defer settlement of the liability for at least 12 months after the reporting period.
Borrowings cost
In accordance with IAS 23, the Group’s loan agreements are subject to the following principles relating to borrowing costs:
General and specific borrowing costs that are attributable to the acquisition, construction or production of a qualifying asset are capitalized during the period of time that is required to complete and prepare the asset for its intended use or sale. Qualifying assets are assets that necessarily take a substantial period of time to get ready for their intended use or sale.
Other borrowing costs are expensed in the period in which they are incurred.
Trade and Other Payables
Trade and other payables represent unpaid liabilities for goods and services provided to the Group prior to the end of the financial year and are presented as current liabilities unless payment is not due within 12 months after the reporting period. Trade and other payables are recognised initially at their fair value and are subsequently measured at amortised cost using the effective interest method.
Pensions
The Group offers a defined contribution plan to its employees and pays contributions to publicly or privately administered pension insurance plans on a mandatory, contractual, or voluntary basis. The Group has no further payment obligations once the contributions have been made. Contributions are recognized as employee benefit expense when they are due and are included as part of salary and personnel costs in the statement of profit and loss.
Statement of cash flows
The accompanying statements of cash flows are prepared in accordance with the indirect method.
Note 2 Critical estimates and judgments
The preparation of financial statements requires the use of accounting estimates which, by definition, will seldom equal the actual results. Management also needs to exercise judgement in applying the Group’s accounting policies.
In the process of applying the Group’s accounting policies, management has made the following judgements, which have the most significant effect on the amounts recognised in the Group’s financial statements:
1) Biological assets
Biological assets comprise of eggs, smolt and live fish in each tank at the grow-out facility at Indre Harøy. These assets are accounted for in accordance with IAS 41 and measured at fair value unless the fair value cannot be measured reliably. The estimation of fair value relies on a series of uncertain assumptions, e.g., biomass volume, quality, size, market prices, expected future costs, remaining time to harvest.
All deviations in biomass volume compared to estimates, is measured when a tank is harvested out. The deviations are normally relatively minor. Similarly, the quality of the fish can normally be estimated with a relatively high degree of certainty, based on historic data and regular controls, given that the fish is kept in a controlled environment in each tank. Categorisation of quality is set at facility level. Given that Salmon Evolution split and grade each batch two times in each production cycle, the size distribution in each batch harvested is normally minor.
The accumulated production cost is based on an allocation of cost to each batch at tank level. The accumulated production cost per kg will normally only deviate from the estimate if the biomass volume is different from the estimate. For estimation of future production costs, there is uncertainty with regards to feed prices, other input costs and biological development. Salmon Evolution tracks and measures cost development vs. expectation for all batches as part of the normal monthly financial closing process. The estimation of future production costs influences the biomass value through the fair value adjustment.
A key estimate in the estimation of fair value is the assumed market price, which is the price that Salmon Evolution expects to receive at a future date when the live fish is harvested. Given that Salmon Evolution harvest salmon in Norway, Sisalmoni is used with relevant adjustments (see note 6 for more information).
See note 6 for sensitivity analysis of biomass.
2) Capitalised costs as assets under construction
As part of the construction of the Group's production facilities, the Group has capitalized certain costs (such as personnel expenses, rent of premises and equipment and other project-related costs), as "assets under construction" in accordance with IAS 16 based on an allocation key. The allocation key is employee-based and has been calculated based on the employees that are directly involved in the assets under construction's share of the total salary in the Group. Reference is made to note 11 for details of additions to "assets under construction".
3) Financial derivatives
The purpose of the Group's risk management activities is to establish an overview of financial risks that exists at any given time. As of this date the Group has chosen to employ both interest rate swap agreements to create interest rate stability.
See note for 19 for more information on classes of financial instruments measured at fair value.
Note 3 Financial risk and capital management
The Group’s financial assets and liabilities include trade and other receivables, trade and other payables, cash, and borrowings necessary for its operations. The Group’s risk management is carried out by the Group’s finance department. The Group is exposed to market risk, credit risk, and liquidity risk.
Market risk
Market risk is linked to both Interest rate- and currency fluctuations.
Interest Rate
The Group's interest rate risk relates primarily to borrowings from financial institutions with variable interest rates. As of 31 December 2025, outstanding loans from credit institutions amounted to NOK 1,681 million and is subject to an interest rate of NIBOR 3M plus an agreed margin. The Group also have drawn NOK 198 million of the overdraft facility. In addition, the Group has NOK 41 million in lease liabilities. To reduce exposure to fluctuations in the interest rate Salmon Evolution Norway AS has entered interest rate swap contracts of NOK 550 million with several banks. Salmon Evolution ASA is guarantor for the loan.
This loan is part of a financing package consisting of the following:
- NOK 525 million non-amortizing Term Loan Facility which will refinance the Company’s existing NOK 525 million construction loan relating to phase 1 (the “Term Loan”)
- NOK 250 million RCF Capex Facility available for general corporate purposes including Indre Harøy phase 2 capex (the “RCF Facility”)
- NOK 1,450 million Construction Facility available for financing of capex relating to phase 2 at Indre Harøy (the “Construction Facility”)
- NOK 250 million credit facility dedicated to Indre Harøy and phase 2 investments (the "New facility")
Additionally, the Group has a NOK 200 million Overdraft Facility with Nordea.
The loans are floating interest rate loans denominated in NOK with an interest charge based on NIBOR 3M plus an agreed margin.
Incurred interest expenses and establishing fees during construction period are capitalized as part of assets under construction, see note 11 for further details.
In addition, the Group has a debt financing package of NOK 60 million in relation to Salmon Evolution Dale. As per 31 December 2025 NOK 49 million of the NOK 60 million debt financing package was drawn.
The financial reporting includes other comprehensive income (OCI) effects, as the Group holds financial instruments measured at fair value through OCI, nor do we apply hedge accounting that requires recognition of gains or losses in OCI. All relevant financial instruments are either recognized through profit or loss or directly in equity as applicable.
Interest rate sensitivity
| (NOK thousands) | 2025 | 2024 |
|---|---|---|
| Interest expense effect of a 1% increase on floating interest rate | 19,209 | 7,280 |
Foreign Currency
The Group's foreign currency risk relates to the Group's operating, investing, and financing activities denominated in a foreign currency. This includes the Group's revenues, expenses and capital expenditure. The Group have no other exposure to foreign exchange risk, and therefore not exposed to fluctuation in currencies.
The Group has entered into a price hedging agreement where the valuation is based on expected monthly cash flows calculated as the difference between the agreed fixed price and the expected market price, multiplied by the contracted volume. The cash flows are discounted using a WACC of ~7% (~0.6% per month). Market prices are based on forward curves from Sisalmoni and translated into NOK using an EUR/NOK exchange rate of 11.8.
The net present value of the contract as of 31 December 2025 amounts to NOK -0.4 million.
The Group's presentation currency is Norwegian Kroner ("NOK").
Credit risk
With respect to credit risk arising from the financial assets of the Group, which comprise cash and cash equivalents, and other receivables, the Group's exposure to credit risk arises from default of the counterparty, with a maximum exposure equal to the carrying amount of these instruments. The Group has procedures to ensure that products are only sold to customers with satisfactory creditworthiness, where credit insurance is used when deemed necessary. This risk is, per 31.12.2025, not considered to be material.
In 2025 the majority of produced fish was sold to Salmon Evolution Sales AS, which in turn sold it to external customers. The sales company secures the bulk of its sales through credit insurance. In addition, the Group also sold part of one group of post smolt to an external customer from Salmon Evolution Norway AS.
Liquidity risk
A lack of liquidity will entail a risk that the Group will not be able to pay its obligations on maturity. Management monitors rolling forecasts of the Group’s liquidity reserve (comprising cash and cash equivalents) based on expected cash flows. The Group’s business plan and growth strategy is capital intensive, and the Group may be dependent upon future equity issues and/or debt financing to finance its current long-term plans.
The table below presents the maturities on the Group’s financial liabilities. The amounts disclosed in the table are the contractual undiscounted cash flows.
| 31 December 2025 (NOK thousands) | Less than 3 months | 3-12 months | 1-5 years |
|---|---|---|---|
| Borrowings | 300 | 334,271 | 1,545,228 |
| Interest (Long term debt) | 32,506 | 97,517 | 500,239 |
| Lease liabilities | 2,887 | 8,465 | 28,574 |
| Trade payables | 176,788 | 15,259 | 0 |
| Total financial liabilities | 212,481 | 455,512 | 2,074,041 |
| 31 December 2024 (NOK thousands) | Less than 3 months | 3-12 months | 1-5 years |
|---|---|---|---|
| Borrowings | 300 | 159,388 | 571,543 |
| Interest (Long term debt) | 15,325 | 45,974 | 245,194 |
| Lease liabilities | 1,329 | 4,087 | 9,043 |
| Trade payables | 193,384 | 0 | 0 |
| Total financial liabilities | 210,338 | 209,449 | 825,780 |
| Trade receivables | ||
|---|---|---|
| (NOK thousands) | 2025 | 2024 |
| Trade receivables | 10,314 | 90,637 |
| Provision for loss on claims | 0 | -115 |
| Total trade receivables | 10,314 | 90,522 |
| Credit-insured share of trade receivables as of 31.12.2025 was NOK 6.1 million. | ||
Financial instruments – assessment of fair value
The table below shows financial instruments at fair value according to valuation method. The different levels are defined as follows:
Level 1: Price listed in an active market for identical assets or liabilities
Level 2: Valuation is based on other observable inputs either directly or indirectly than listed price (used in level 1) for the asset or liability
Level 3: Valuation based on inputs not derived from observable markets (non-observable assumptions)
| 31 December 2025 | FVPL* | |||||
|---|---|---|---|---|---|---|
| (NOK thousands) | Level 1 | Level 2 | Level 3 | Amortized cost | Fair value | Carrying amount |
| Financial assets: | ||||||
| Trade receivables | - | - | - | 10,314 | 10,314 | 10,314 |
| Financial derivatives | - | 10,254 | - | - | 10,254 | 10,254 |
| Other current receivables | - | - | - | 51,585 | 51,585 | 51,585 |
| Cash and cash equivalents | - | - | - | 163,438 | 163,438 | 163,438 |
| Total financial assets | - | 10,254 | - | 225,337 | 235,591 | 235,591 |
| Financial liabilities: | ||||||
| Long-term interets bearing debt | - | - | - | 1,545,228 | 1,545,228 | 1,545,228 |
| Other long term liabilites | - | - | - | 3,643 | 3,643 | 3,643 |
| Short-term interest bearing debt | - | - | - | 334,571 | 334,571 | 334,571 |
| Trade payables | - | - | - | 192,047 | 192,047 | 192,047 |
| Social security and other taxes | - | - | - | 7,527 | 7,527 | 7,527 |
| Other current liabilities | - | - | - | 28,842 | 28,842 | 28,842 |
| Total financial liabilities | - | - | - | 2,111,858 | 2,111,858 | 2,111,858 |
| *FVPL: Fair value through profit or loss | ||||||
| 31 December 2024 | FVPL* | |||||
|---|---|---|---|---|---|---|
| (NOK thousands) | Level 1 | Level 2 | Level 3 | Amortized cost | Fair value | Carrying amount |
| Financial assets: | ||||||
| Trade receivables | - | - | - | 90,522 | 90,522 | 90,522 |
| Financial derivatives | - | 13,643 | - | - | 13,643 | 13,643 |
| Other current receivables | - | - | - | 51,142 | 51,142 | 51,142 |
| Cash and cash equivalents | - | - | - | 429,462 | 429,462 | 429,462 |
| Total financial assets | - | 13,643 | - | 571,126 | 584,769 | 584,769 |
| Financial liabilities: | ||||||
| Long-term interets bearing debt | - | - | - | 569,100 | 569,100 | 569,100 |
| Other long term liabilites | - | - | - | 3,643 | 3,643 | 3,643 |
| Short-term interest bearing debt | - | - | - | 158,488 | 158,488 | 158,488 |
| Trade payables | - | - | - | 193,384 | 193,384 | 193,384 |
| Social security and other taxes | - | - | - | 7,080 | 7,080 | 7,080 |
| Other current liabilities | - | - | - | 14,408 | 14,408 | 14,408 |
| Total financial liabilities | - | - | - | 946,103 | 946,103 | 946,103 |
| *FVPL: Fair value through profit or loss | ||||||
Note 4 Operating revenue and other income
Operating revenue and other income
| (NOK thousands) | 2025 | 2024 |
|---|---|---|
| Sales revenues from farming | 325,250 | 467,742 |
| Smolt | 8,355 | 0 |
| Postsmolt | 10,851 | 11,305 |
| Atlantic Salmon (hog) | 302,398 | 451,398 |
| Atlantic Salmon (trimmed) | 3,646 | 5,039 |
| Other income | 772 | 3,831 |
| Total operating revenue | 326,022 | 471,573 |
Operating revenue in the Group for 2025 mainly derives sales of farmed salmon from Salmon Evolution Sales AS (who bought the salmon from Salmon Evolution Norway AS). Salmon Evolution Sales AS has in 2025 sold 4,315 tonnes Atlantic Salmon, and the distribution is as illustrated below. Additionally, 88 tonnes postsmolt (HOG converted) were sold directly from Salmon Evolution Norway AS and 96 tonnes smolt from Salmon Evolution Dale AS to external customers.
| 2025 | 2024 | |||
|---|---|---|---|---|
| Destination | Sales quantity (tonnes) | % | Sales quantity (tonnes) | % |
| Norway | 1,876 | 43 % | 2,642 | 55 % |
| Europe ex. Norway | 2,389 | 55 % | 2,107 | 44 % |
| Asia | 50 | 1 % | 54 | 1 % |
| Total | 4,315 | 100 % | 4,803 | 100 % |
| Sales renevue atlantic salmon | 2025 | 2024 |
|---|---|---|
| Norway | 123,143 | 245,786 |
| EU ex. Norway | 178,165 | 204,057 |
| Asia | 4,735 | 6,594 |
| Total | 306,043 | 456,437 |
Note 5 Segment
Operating segments are reported in a manner consistent with internal reporting to the chief operating decision-maker, which is responsible for allocating resources and assessing performance. The chief operating decision-maker has been identified as the Group management. The Group has implemented segment reporting which consists of production of farmed salmon in Norway (Farming Norway), other activities (Other), and eliminations. The segment performance is monitored to assess performance and profitability at a strategic level.
Farming Norway consists of Salmon Evolution Norway AS (grow-out facility), Salmon Evolution Dale AS (smolt facility) and Salmon Evolution Sales AS. Additionally a portion of the Group overhead costs is allocated to the segment.
Other consists of both revenue and costs not attributable to the farming segment.
The same accounting principles as described in Note 1 have been applied for the segment reporting, where internal transactions are entered into under normal commercial terms and conditions.
Sales revenue from contracts with customers comes from both Continental Europe, UK, USA, Asia and other markets.
| FY 2025 | ||||
|---|---|---|---|---|
| (NOK thousands) | Farming Norway | Other | Eliminations | Group |
| External revenue | 325,250 | 772 | 0 | 326,022 |
| Internal revenue | 0 | 33,500 | -33,500 | 0 |
| Operating revenue | 325,250 | 34,272 | -33,500 | 326,022 |
| Change in inventory | 43,711 | 0 | 0 | 43,711 |
| Cost of materials | -205,055 | 0 | 1,991 | -203,064 |
| Personnel expenses | -49,976 | -53,044 | 22,022 | -80,998 |
| Other operating expenses | -153,413 | -20,431 | 9,487 | -164,357 |
| Operational EBITDA | -39,483 | -39,203 | 0 | -78,686 |
| Operational EBIT | -116,399 | -44,404 | 1,896 | -158,906 |
| Fair value adjustment of biomass | 15,630 | |||
| Net financial | -28,324 | |||
| Profit/loss before tax | -171,601 | |||
| Harvested volum (tonnes, HOG) | 4,403 | 4,403 | ||
| Operational EBITDA/kg (NOK) | -9.0 | -17.9 | ||
| Operational EBIT/kg (NOK) | -26.4 | -36.1 | ||
| Total assets* | 3,644,993 | 33,459 | 38,636 | 3,717,088 |
| FY 2024 | ||||
| (NOK thousands) | Farming Norway | Other | Eliminations | Group |
| External revenue | 467,742 | 3,831 | 0 | 471,573 |
| Internal revenue | 0 | 24,329 | -24,329 | 0 |
| Operating revenue | 467,742 | 28,160 | -24,329 | 471,573 |
| Change in inventory | 29,603 | 0 | 0 | 29,603 |
| Cost of materials | -200,542 | 0 | -391 | -200,933 |
| Personnel expenses | -34,340 | -48,691 | 151,077 | 68,046 |
| Other operating expenses | -150,038 | -20,479 | -126,357 | -296,874 |
| Operational EBITDA | 112,425 | -41,010 | 0 | 71,415 |
| Operational EBIT | 37,884 | -44,509 | 1,898 | -4,727 |
| Fair value adjustment of biomass | -10,498 | |||
| Net financial | -32,180 | |||
| Profit/loss before tax | -47,405 | |||
| Harvested volum (tonnes, HOG) | 4,891 | 4,891 | ||
| Operational EBITDA/kg (NOK) | 23.0 | 14.6 | ||
| Operational EBIT/kg (NOK) | 7.7 | -1.0 | ||
| Total assets* | 2,371,935 | 33,086 | 0 | 2,405,021 |
| *Total assets excluding investments in associated companies and other long-term receivables (non-current assets) and all current assets | ||||
Note 6 Biological assets and inventory
Biological assets are, in accordance with IAS 41, measured at fair value. For salmon in the grow-out facility, a present value model is applied to estimate the fair value. For roe, fry and smolt, historical cost is deemed to provide the best estimate of fair value, and hence applied.
The fair value of fish in the grow-out facility is calculated by multiplying the estimated biomass at the time of harvest with the estimated sales price at the same time and deducted for estimated costs to sell. For fish not ready for harvest, remaining production costs to grow the fish to harvest weight are deducted. The cash flow is further discounted by a discount rate considering both risk adjustment and time value.
The Group considers that fish greater than 4.6 kg is ready for harvest (about 3.8 kg gutted weight), and such fish is thus classified as harvestable fish. Fish that have not achieved this weight are classified as non-harvestable.
In the event of incident-based mortality, all costs allocated to fish affected by incident-based mortality will be deducted from the book value of the inventory.
Book value of inventory
| (NOK thousands) | FY 2025 | FY 2024 |
|---|---|---|
| Equipment | 6,721 | 6,245 |
| Raw materials | 4,630 | 6,621 |
| Biological assets | 232,335 | 171,004 |
| Total | 243,686 | 183,870 |
Biological assets
| (in tonnes) | FY 2025 | FY 2024 |
|---|---|---|
| Biological assets end of period | 3,115 | 2,023 |
Biological assets
| (NOK thousands) | FY 2025 | FY 2024 |
|---|---|---|
| Biological assets beginning of period | 171,004 | 153,790 |
| Increase due to production | 411,389 | 371,472 |
| Reduction due to harvest/sale | -365,687 | -334,727 |
| Reduction due to incident based mortality | 0 | -9,473 |
| Fair value adjustment beginning of period | -21,391 | -31,889 |
| Fair value adjustment end of period | 37,021 | 21,391 |
| Biological assets end of period | 232,335 | 171,004 |
The estimated biomass volume is based on the actual number of individuals in the grow-out departments on the balance sheet date, adjusted for projected mortality up to harvest time and multiplied with the estimated harvest weight per individual at harvest time.
The estimated sales price for the fish in the grow-out facility is based on forward prices from Sisalmoni with relevant adjustments. The net sales value is adjusted for expected quality differences and harvesting, logistics and sales expenses.
Sensitivity analysis of biomass
This sensitivity analysis evaluates the impact of changes in key estimates on fair value. It highlights how variations in factors such as sales prices, biomass volume, discount rate and superior share could affect the fair value measurement, providing a clearer understanding of potential financial impacts.
| (NOK thousands) | 2025 | 2024 |
|---|---|---|
| Change in sales price +1 NOK/kg | 5,729 | 3,645 |
| Change in sales price -1 NOK/kg | -5,729 | -3,645 |
| Changes in biomass volume -1% kg | -5,106 | -2,295 |
| Changes in biomass volume +1% kg | 5,106 | 2,295 |
| Change in discount rate +1% | -164 | -400 |
| Change in discount rate -1% | 164 | 400 |
| Change in superior share +1% | 816 | 545 |
| Change in superior share -1% | -816 | -545 |
Note 7 Cost of materials and change in inventory
| (NOK thousands) | 2025 | 2024 |
|---|---|---|
| Cost of materials and change in inventory | -159,353 | -171,330 |
Composition COGS:
| (NOK thousands) | 2025 | 2024 |
|---|---|---|
| Raw material cost | -203,064 | -200,933 |
| Inventory change | 43,711 | 29,603 |
| Sum | -159,353 | -171,330 |
Composition inventory change:
| (NOK thousands) | 2025 | 2024 |
|---|---|---|
| Change due to production | 411,389 | 371,472 |
| Change due to harvest/sale | -365,687 | -336,093 |
| Change due to incident based mortality | 0 | -6,167 |
| Change inventory raw material | -1,991 | 391 |
| Sum | 43,711 | 29,603 |
Composition – change due to production:
| (NOK thousands) | 2025 | 2024 |
|---|---|---|
| Raw material cost | 205,055 | 200,542 |
| Salaries | 49,976 | 34,340 |
| Energy cost | 48,605 | 48,330 |
| Depreciations | 65,854 | 55,758 |
| Other operating expenses | 41,900 | 32,503 |
| Sum | 411,389 | 371,472 |
Inventory
| (NOK thousands) | Feed | Smolt | Salmon | Total at cost | Fair value adjustment |
|---|---|---|---|---|---|
| Value 31.12.2024 | 6,621 | 23,431 | 126,182 | 156,234 | 21,391 |
| Change | -1,991 | -4,090 | 49,791 | 43,711 | 15,630 |
| Value 31.12.2025 | 4,630 | 19,341 | 175,973 | 199,945 | 37,021 |
Note 8 Personnel expenses, remuneration to the board and auditor's fee
| (NOK thousands) | 2025 | 2024 |
|---|---|---|
| Salaries | 80,510 | 76,550 |
| Social security | 13,465 | 12,256 |
| Pensions | 5,285 | 4,350 |
| Other benefits | 1,389 | 1,593 |
| Share-based payments | 2,044 | 726 |
| Gross personnel expenses | 102,693 | 95,475 |
| - Capitalized costs | -21,695 | -27,428 |
| Total personnel expenses recognized in P&L | 80,998 | 68,046 |
| Number of full-time employment equivalents | 89 | 81 |
During the ordinary course of business, the Group capitalizes portions of total salary and personnel costs towards assets under construction. In addition, a portion of the salaries related to the production are recognised as part of the biomass value in the balance sheet. Salary allocated to biomass in 2025 was NOK 51.5 million (NOK 34.4 million in 2024).
Norwegian entities are obligated to establish a mandatory company pension. This obligation is fulfilled under the current pension plan. No loans or guarantees have been given to the members of the board of directors or executive management.
Remuneration and compensation to executive management and board of directors
| (NOK thousands) | 2025 | 2024 |
|---|---|---|
| Salaries and other short-term employee benefits | 13,912 | 14,276 |
| Share-based payments | 1,172 | 313 |
| Remuneration and compensation to members of the board | 2,865 | 2,725 |
For personnel expenses and remuneration to the board see our remuneration report for 2025, published on our website salmonevolution.no.
Auditor's remuneration
| (NOK thousands) | 2025 | 2024 |
|---|---|---|
| Statutory audit | 1603 | 1423 |
| Other assurance services | 113 | 0 |
| Other services | 8 | 316 |
| Total | 1,724 | 1,739 |
Note 9 Share based payments
In 2024 the Board of directors granted a tranche of stock options. Each option gave the holder the right to subscribe or purchase shares in Salmon Evolution at an average agreed exercise price of NOK 8.30. The options were granted on 18 September for both executive management and key employees. 1/3 of the options can be exercised at earliest 12 months, 1/3 of the options can be exercised after 24 months, and 1/3 of the options can be exercised after 36 months, after the grant date. To account for this, an adjusted Black & Scholes option-pricing model is used by applying a weighted expected average life of 18 months.
Furthermore, in 2025 the Board of directors granted another tranche of stock options. Each option gives the holder the right to subscribe or purchase shares in Salmon Evolution at an average agreed exercise price of NOK 6.0. The options were granted on 27 August for both executive management and key employees. 1/3 of the options can be exercised at earliest 12 months, 1/3 of the options can be exercised after 24 months, and 1/3 of the options can be exercised after 36 months, after the grant date. To account for this, an adjusted Black & Scholes option-pricing model is used by applying a weighted expected average life of 18 months.
The fair value of the options is set on the grant date and is expensed over its lifetime. The fair value of the options has been calculated using the adjusted Black & Scholes option-pricing model, which takes into account the exercise price, the term of the option, the share price at the grant date, expected price volatility of the underlying share, expected dividend and risk-free rates. Given the recent listing and lack of historical price and volatility data, the expected volatility is based on historical volatility for a selection of comparable companies listed on Oslo Stock Exchange ("Oslo Børs"). The risk-free interest rate is set to equal the interest on Norwegian government bonds with the same maturity as the option. Average key assumptions are listed below.
| Outstanding options (NOK thousands) | 2025 | 2024 |
|---|---|---|
| Outstanding options 1 January | 10,940 | 7,060 |
| Options granted | 4,535 | 3,880 |
| Options exercised | 0 | 0 |
| Options forfeited | 403 | 0 |
| Outstanding options at end of period | 15,072 | 10,940 |
| (NOK thousands) | 2025 | 2024 |
|---|---|---|
| Charges to income statement | 1,827 | 696 |
| Charges to Asset under Construction | 0 | 28 |
| Total charges | 1,827 | 725 |
| Key assumptions | 2025 | 2024 |
|---|---|---|
| Average fair value (NOK) | 0.83 | 1.10 |
| Average exercise price (NOK) | 6.00 | 7.50 |
| Weighted expected average life (in years) | 5.00 | 5.00 |
| Estimated dividend per share (NOK) | 0,00 | 0,00 |
| Expected average volatility | 25.8 % | 26.9 % |
| Risk-free rate | 4.04 % | 3.62 % |
| Group management have the following holdings | Holding 01.01 | Awarded | Exercised | Forfeitet | Holding 31.12 |
|---|---|---|---|---|---|
| Trond Håkon Schaug-Pettersen (CEO) | 3,600 | 1,000 | 0 | 0 | 4,600 |
| Trond Vadset Veibust (CFO) | 1,000 | 500 | 0 | 0 | 1,500 |
| Ingjarl Skarvøy (COO) | 1,050 | 300 | 0 | 0 | 1,350 |
| Kamilla Mordal Holo (Project Director) | 1,050 | 300 | 0 | 0 | 1,350 |
| Odd Frode Roaldsnes (CCO) | 1,050 | 300 | 0 | 0 | 1,350 |
| Vidar Skjørli (HR Director) | 90 | 125 | 0 | 0 | 215 |
| Total | 7,840 | 2,525 | 0 | 0 | 10,365 |
| *Numbers in thousand | |||||
Note 10 Other operating expenses
| (NOK thousands) | 2025 | 2024 |
|---|---|---|
| Cost of premises (not defined as RoU) | 5,591 | 5,968 |
| Rented equipment | 1,580 | 6,900 |
| Insurance | 6,259 | 5,533 |
| Consultancy fees | 6,543 | 10,920 |
| Electrisity | 48,629 | 48,287 |
| Other operating expenses | 51,261 | 41,329 |
| Other administrative expenses | 44,494 | 41,845 |
| Total other operating expenses | 164,357 | 160,781 |
Note 11 Property, plant, equipment and intangible asset
| (NOK thousands) | Intangible assets | Assets under construction | Assets in use, not allocated | Buildings | Fixtures and fittings | Right-of-use assets | Total |
|---|---|---|---|---|---|---|---|
| Cost 1 January 2024 | 72,350 | 70,781 | 54,019 | 1,582,996 | 310,888 | 22,163 | 2,113,198 |
| Additions | 12,184 | 391,137 | 0 | 7,987 | 9,502 | 7,623 | 428,433 |
| Reclassified constructions | 0 | 19,859 | -54,019 | 7,756 | 26,404 | 0 | 0 |
| Reclassification according to IFRS 16* | 0 | 0 | 0 | 0 | -4,692 | 0 | -4,692 |
| Other reclassifications | -3,398 | 0 | 0 | 0 | 0 | 3,398 | 0 |
| Cost 31 December 2024 | 81,136 | 481,778 | 0 | 1,598,740 | 342,102 | 33,185 | 2,536,939 |
| Acc. depreciation 1 January 2024 | -3 | 0 | 0 | -27,711 | -17,984 | -10,079 | -55,776 |
| Depreciation for the period | -32 | 0 | 0 | -40,366 | -30,496 | -5,249 | -76,143 |
| Net book value 31 December 2024 | 81,101 | 481,778 | 0 | 1,530,665 | 293,622 | 17,858 | 2,405,020 |
| (NOK thousands) | Intangible assets | Assets under construction | Assets in use, not allocated | Buildings | Fixtures and fittings | Right-of-use assets | Total |
|---|---|---|---|---|---|---|---|
| Cost 1 January 2025 | 81,136 | 481,778 | 0 | 1,598,740 | 342,102 | 33,185 | 2,536,939 |
| Additions | 5,210 | 1,299,303 | 0 | 26,846 | 19,392 | 37,286 | 1,388,035 |
| Cost 31 December 2025 | 86,346 | 1,781,080 | 0 | 1,625,586 | 361,493 | 70,471 | 3,924,974 |
| Accumulated depreciation 1 January 2025 | -34 | 0 | 0 | -68,076 | -48,480 | -15,328 | -131,918 |
| Reversal of prior-period depreciation | 0 | 0 | 0 | 0 | 4,252 | 0 | 4,252 |
| Depreciation for the period | -1,804 | 0 | 0 | -40,803 | -27,984 | -9,629 | -80,221 |
| Net book value 31 December 2025 | 84,508 | 1,781,081 | 0 | 1,516,706 | 289,281 | 45,513 | 3,717,088 |
| Estimated lifetime | 3-10 years | n/a | n/a | 10-75 years | 3-50 years | 3-5 years | |
| Depreciation method | Linear | n/a | n/a | Linear | Linear | Linear |
* The previously capitalised value of leased land has been reclassified in accordance with IFRS 16 due to the fact that the lease payments are a variable cost based on a percentage of sales.
Straight-line depreciation is applied over the useful life of property, plant, and equipment based on the assets’ historical cost and estimated residual value at disposal. Depreciation is charged to expense when the property, plant or equipment is ready for use or placed in service.
Earned grants that go in the balance sheet is included in new additions and are netted against the related asset’s acquisition. See note 16 for further information.
Capitalization of costs as asset under construction
Costs incurred recognised as part of "Other operating expenses" in the "Statement of Profit or Loss" during 2025 has been capitalized as of 31 December 2025 as these costs are deemed to be part of the ongoing assets under construction and qualify for capitalisation in accordance with IAS 16. As a result, the reported "Other operating expenses" in 2025 reflects the cost incurred during this period, net of such capitalized costs related to the entire 12 months period ending 31 December 2025 which amounted to approximately NOK 107.3 million.
| Capitalized internal cost | 01.01.2025 | Additions | 31.12.2025 |
|---|---|---|---|
| Salary | 73,911 | 26,132 | 100,043 |
| Rental/equipment | 7,618 | 0 | 7,618 |
| Interest | 80,867 | 81,154 | 162,021 |
| Total | 162,396 | 107,286 | 269,682 |
| Capitalized internal cost | 01.01.2024 | Additions | 31.12.2024 |
|---|---|---|---|
| Salary | 60,359 | 13,552 | 73,911 |
| Rental/equipment | 7,618 | 0 | 7,618 |
| Interest | 55,780 | 25,087 | 80,867 |
| Total | 123,757 | 38,639 | 162,396 |
Contractual and financial commitments
During 2024 the Group reached an agreement on the final settlement for the construction of phase 1 at Indre Harøy. As to the ongoing development of phase 2 at Indre Harøy, the Company has started the construction, with the first smolt expected in H1 2026.
Intangible Assets
The group is working on several development projects aimed at optimizing both biological processes and technical/building designs. This work is carried out using internal resources across the corporate structure and through purchased services. For accounting purposes, expenses related to development projects are partly capitalized and partly expensed. The use of internal employees is primarily expenditure, as we consider that the employees’ time spent on development work also benefits ongoing operations.
External services are capitalized as R&D projects, and the depreciation period for each project will be assessed as the projects are completed, allowing for an estimation of their expected useful life.
The majority of development projects are related to ongoing FOU and Skattefunn projects, and is not amortised.
| Intangible Assets | 01.01.2025 | Reclassifications | Additions | Grants | Depreciations | 31.12.2025 |
|---|---|---|---|---|---|---|
| Development projects* | 20,008 | 0 | 5,204 | 0 | -1,772 | 23,439 |
| Trademark | 3,372 | 0 | 7 | 0 | -32 | 3,347 |
| Water rights | 13,487 | 0 | 0 | 0 | 0 | 13,487 |
| Goodwill | 44,235 | 0 | 0 | 0 | 0 | 44,235 |
| Total | 81,102 | 0 | 5,210 | 0 | -1,804 | 84,508 |
| *See note 16 for more information | ||||||
| Intangible Assets | 01.01.2024 | Reclassifications | Additions | Grants | Depreciations | 31.12.2024 |
|---|---|---|---|---|---|---|
| Development projects* | 8,137 | 0 | 13,466 | -1,596 | 0 | 20,008 |
| Trademark | 3,349 | 0 | 55 | 0 | -32 | 3,372 |
| Water rights | 16,597 | -3,398 | 289 | 0 | 0 | 13,488 |
| Goodwill | 44,235 | 0 | 0 | 0 | 0 | 44,235 |
| Total | 72,317 | -3,398 | 13,810 | -1,596 | -32 | 81,102 |
| *See note 16 for more information | ||||||
Impairment testing of goodwill and intangibles
Goodwill and intangible assets with undefined economic lives is subject to an annual impairment test. The Group did not recognize any impairment of goodwill and intangibles in 2025. In 2025 the Group has assets that need to be impairment tested (including goodwill and water rights). The Group has defined the Farming segment as a cash generating unit (CGU), and goodwill and water rights corresponding to NOK 57.7 million are allocated to this CGU.
The impairment is done using the Groups rolling projections which are based on financial budgets where cash generating activities forms the basis of the valuation. This is done over a five-year period. The key assumptions for the analysis are EBITDA, EBITDA development within the company, and WACC. Budgeted EBITDA margin is calculated using a forward salmon price in line with market expectations, and an expected cost of production that is somewhat declining over the coming years (in line with scaling of operations). Further, the annual reinvestment is assumed to be equal to annual depreciations. Cash flow forecasts are estimated after tax, and weighted average cost of capital is set to be ~7%. The cost of capital is calculated using a WACC model where market expectations in regard to risk free rate and risk premiums (both marked and debt risk), and the beta is calculated using the average beta of several peers. It is not expected that using a before tax rate would have given any value adjustments. Terminal value is calculated using Gordons Growth Model and a growth rate of 2%. As a result of the impairment testing, no need for impairment has been identified.
Note 12 Finance income and finance cost
| Finance income (NOK thousands) | 2025 | 2024 |
|---|---|---|
| Interest income | 5,916 | 21,250 |
| Change in value of financial derivatives (gain) | 0 | 977 |
| Foreign exchange gains | 3,811 | 5,338 |
| Other finance income | 19 | 674 |
| Financial income | 9,746 | 28,239 |
| Share of net income from associated companies | -5,477 | -7,809 |
| Total financial income | 4,269 | 20,430 |
| Finance expenses (NOK thousands) | 2025 | 2024 |
|---|---|---|
| Interest on debts and borrowings | 110,508 | 53,232 |
| Capitalised borrowing costs - general borrowings | -36,742 | 0 |
| Capitalised borrowing costs - specific borrowings | -44,413 | 0 |
| Realized loss/-gain on interest derivative | -6,019 | -5,966 |
| Change in value of financial derivatives (loss) | 3,005 | 4,460 |
| Foreign exchange losses | 5,340 | 0 |
| Other finance expenses | 914 | 884 |
| Total financial expenses | 32,593 | 52,610 |
| Net financial income/- expenses | -28,324 | -32,180 |
| Fair value adjustments - financial assets (NOK thousands) | 2025 | 2024 |
|---|---|---|
| Unrealised changes in the value of interest rate swap | -3,005 | 977 |
| Unrealised changes in the value of salmon price hedging | -384 | 0 |
| Fair value adjustments recognised in profit and loss | -3,389 | 977 |
Interest income is mainly related to interest on cash deposits held with Norwegian financial institutions.
Incurred interest expenses and establishing fees are capitalized as part of assets under construction in accordance with IAS 23.
The Group has reassessed its application of IAS 23 Borrowing cost and its effect on capitalisation of borrowing cost related to financing of Indre Harøy. Application of IAS 23 has been taken into consideration where the Company has general borrowings which has partly been financing qualifying assets but not been directly allocated to the construction of a qualifying asset. The effect for 2025 is a total of 36,7 NOKm of interest costs that have been capitalized on the project. The effects on periods prior to 2025 is considered immaterial.
The negative impact from share of net income from associated companies is related to a loss at K Smart Farming Co., Ltd.
The Group did not have any fair value adjustments of financial liabilities in 2025, nor in 2024.
Note 13 Investment in assosiated companies
The group has the following investments in associated companies:
| Location and place of business | Ownership | Voting share | |
|---|---|---|---|
| K Smart Farming Co., Ltd | Gangwangnak-ro, South Korea | 49 % | 49 % |
Movement in investment in associated company
| Share of net income 2024 | -7,809 | |
| Foreign currency translation gain/(loss) 2024 | -178 | |
| Net book value 31 Dec 2024 | 10,689 | |
| Share of net income 2025 | -5,478 | |
| Foreign currency translation gain/(loss) 2025 | 862 | |
| Net book value 31 Dec 2025 | 6,073 |
Investments in associated companies are recognized using the equity method.
Salmon Evolution International AS owns 49% of K Smart Farming Co., Ltd together with Dongwon Industries Co., Ltd.
The Company currently sees the overall project economics as challenging, primarily driven by site specific circumstances at the Yangyang grow-out site, in particular related to the intake and discharge water solution due to a relatively long and shallow shoreline at the grow-out site. Additionally, given that Korea has no existing salmon farming industry, certain other infrastructure items are impacting on the project cost as well as operating cost.
Throughout 2025, work has been carried out on financing and realization of the project. In this connection, the Company and Dongwon Industries have also updated the agreements governing the execution of the project, dated 22 December 2025.
The updated contractual framework consists of a Settlement Agreement and a Technical Advisory Agreement. In brief, Salmon Evolution will be going forward act as an advisor to the project on market-based terms, while retaining existing rights and maintaining an ownership interest of up to 1/3 of K Smart Farming. The acquisition cost of the ownership interest acquired in 2021 amounts to NOK 27,412,505. The investment is recognized at a value corresponding to the ownership interest in the company, amounting to NOK 6,073,450 as of 31 December 2025.
Note 14 Taxes
Calculation of current and deferred tax/ deferred tax benefit
| (NOK thousands) | 2025 | 2024 |
|---|---|---|
| Intangible assets | 57,722 | 57,722 |
| Fixed assets | 376,002 | 230,277 |
| Accounts receivable | 0 | -115 |
| Inventories | 232,335 | 171,004 |
| Right-of-use assets | 45,513 | 17,857 |
| Lease liabilities | -44,718 | -18,629 |
| Other current liabilities | 444 | 0 |
| Net temporary differences | 667,297 | 458,116 |
| Tax losses carried forward | -1,174,641 | -805,215 |
| Change due to unrealized financial instruments | 10,254 | 12,666 |
| Basis for deferred tax (deferred tax asset) | -497,090 | -334,433 |
| Deferred tax (22%) | -109,360 | -73,575 |
| Deferred tax benefit not recognized in the balance sheet* | 109,360 | 73,575 |
| Deferred tax in the balance sheet | 0 | 0 |
| *Deferred tax benefit has historically not been recognized in the balance sheet as the Group is in its start-up phase and does not have any historical results to refer to when assessing whether future taxable profits will be sufficient to utilize the tax benefit. | ||
Basis for income tax expense, changes in deferred tax and tax payable
| (NOK thousands) | 2025 | 2024 |
|---|---|---|
| Result before taxes | -171,601 | -47,405 |
| Permanent differences in relation to skattefunn | 0 | -2,258 |
| Other permanent differences | 6,531 | -8,121 |
| Basis for the tax expense | -165,069 | -57,784 |
| Change in temporary differences | -209,168 | -103,874 |
| Change due to equity transactions | 0 | 0 |
| Change in tax losses carried forward | -374,237 | -161,658 |
| Basis for payable taxes in the income statement | 0 | 0 |
Components of the tax expense
| (NOK thousands) | 2025 | 2024 |
|---|---|---|
| Payable tax on this year's result | 0 | 0 |
| Total payable tax | 0 | 0 |
| Change in deferred tax | -35,785 | -13,152 |
| Change in deferred tax due to previous year group contribution | 0 | -415 |
| Change in deferred tax not capitalized in the balance sheet | 35,785 | 13,567 |
| Tax expense | 0 | 0 |
Reconciliation of the tax expense with the nominal tax rate
| (NOK thousands) | 2025 | 2024 |
|---|---|---|
| Result before taxes | -171,601 | -47,405 |
| Calculated tax (22%) | -37,752 | -10,429 |
| Tax expense | 0 | 0 |
| Difference | 37,752 | 10,429 |
| The difference consists of: | ||
|---|---|---|
| Tax on permanent differences | 1,437 | -2,283 |
| Change in tax rate | 0 | 0 |
| Change in deferred tax | 0 | 0 |
| Change in deferred tax due to change in tax rate | 0 | 0 |
| Change in deferred tax not shown in the balance sheet | 35,785 | 13,567 |
| Change in defferred tax due to acquisition | 0 | 0 |
| Change due to unrealized financial instruments | 531 | -855 |
| Sum explained differences | 37,752 | 10,429 |
Note 15 Earnings per share
| (NOK thousands) | 2025 | 2024 |
|---|---|---|
| Loss for calculation of diluted earnings per share | -171,601 | -47,405 |
| Loss for calculation of diluted earnings per share | -171,601 | -47,405 |
| Weighted average number of shares outstanding | 462,603,306 | 440,297,748 |
| Dilutive options | 0 | 0 |
| Average number of shares and options used in calculation for diluted EPS | 462,603,306 | 440,297,748 |
| Basic earnings per share (NOK) | -0.37 | -0.11 |
| Diluted earnings per share (NOK) | -0.37 | -0.11 |
Basic earnings per share are based on the weighted average number of common shares outstanding during the period.
FY 2025: The Company had 462,603,306 shares for the whole period.
FY 2024: The Company had 413,936,640 shares until mid June 2024. In June the Company made an issue of 48,666,660 new shares in a capital raise. Therefor the weighted average number of shares outstanding in 2024 has been calculated by applying a weight of 5.5/12 of the number of shares before the capital raise, and 6.5/12 of the total number of shares after the capital raise (462,603,306 shares).
Note 16 Government grants
The Group has received a commitment from the The Norwegian Research Council (Norsk Forskningsråd) for two projects started in 2023. The grant is given for one period of three years and is related to the tax incentive scheme SkatteFUNN which is a government program designed to stimulate research and development (R&D) in Norwegian trade and industry. The grants for 2025 are amounted to NOK 595 thousand.
| (NOK thousands) | Expense | Capitalized | FY 2025 |
|---|---|---|---|
| Systems for data input, handling and analytics | 551 | 2,770 | 3,321 |
| Grants, estimated | -7 | -176 | -183 |
| Landbased Salmon | 1,412 | 1,949 | 3,361 |
| Grants, estimated | -63 | -321 | -383 |
| Light in the fry phase | 0 | 394 | 394 |
| Grants, estimated | 0 | -28 | -28 |
| Total SkatteFUNN project costs | 1,893 | 4,588 | 6,482 |
| (NOK thousands) | Expense | Capitalized | FY 2024 |
|---|---|---|---|
| Systems for data input, handling and analytics | 839 | 6,107 | 6,946 |
| Grants | -159 | -1,160 | -1,320 |
| Landbased Salmon | 1,828 | 1,822 | 3,650 |
| Grants | -347 | -346 | -694 |
| Light in the fry phase | 817 | 469 | 1,286 |
| Grants | -155 | -89 | -244 |
| Total project costs | 2,823 | 6,803 | 9,624 |
Further, the Group has received a commitment from Fisheries and Aquaculture Industry Research Funding (FHF) for the project “Realization of the potential sensor data for improved efficiency and fish welfare”. In the financial accounts, these grants are recognised as income in the P&L. Grants for 2025 amounted to NOK 732 thousand.
| (NOK thousands) | 2025 | 2024 |
|---|---|---|
| FHF | 732 | 1,673 |
| Total grants received | 732 | 1,673 |
Note 17 Leases
Amounts recognised in the balance sheet
| (NOK thousands) | 31 Dec 2025 | 31 Dec 2024 |
|---|---|---|
| Right-of-use assets | ||
| Water rights | 3,398 | 3,398 |
| Rent of premises | 7,240 | 4,630 |
| Car | 1,539 | 1,911 |
| Other equipment | 33,335 | 7,918 |
| Total right-of-use assets | 45,513 | 17,857 |
| Lease liabilities | ||
| Current | 10,987 | 5,317 |
| Non-current | 30,088 | 9,668 |
| Total lease liabilities | 41,075 | 14,986 |
Amounts recognised in the statement of profit or loss
| (NOK thousands) | 31 Dec 2025 | 31 Dec 2024 |
|---|---|---|
| Depreciation right-of-use assets | ||
| Rent of premises | 2,640 | 2,149 |
| Car | 1,184 | 764 |
| Other equipment | 5,805 | 2,336 |
| Gross depreciation | 9,629 | 5,249 |
| - Capitalized as assets under construction | 0 | 0 |
| Net depreciation | 9,629 | 5,249 |
| Interest expense lease liability | 2,512 | 690 |
The total cash outflow for leases in 2025 was NOK 13,7 million (NOK 5,4 million in 2024).
| 2024 (NOK thousands) | Water rights | Rent of premises | Vechicles | Equipment |
|---|---|---|---|---|
| Right-of-use assets 01.01.2024 | 0 | 6,153 | 2,639 | 3,292 |
| Reclassifications | 3,398 | 0 | 0 | 0 |
| Additions | 0 | 626 | 36 | 6,962 |
| Depreciations | 0 | -2,149 | -764 | -2,336 |
| Right-of-use assets 31.12.2024 | 3,398 | 4,630 | 1911 | 7,918 |
| Lease liabilities 01.01.2024 | 0 | 6,393 | 2,792 | 3,353 |
| Additions | 3,643 | 626 | 36 | 6,962 |
| Repayments | 0 | -2,097 | -323 | -2,756 |
| Lease liabilities 31.12.2024 | 3,643 | 4,922 | 2505 | 7,559 |
| 2025 (NOK thousands) | Water rights | Rent of premises | Vechicles | Equipment |
|---|---|---|---|---|
| Right-of-use assets 01.01.2025 | 3,398 | 4,630 | 1,911 | 7,918 |
| Additions | 0 | 5,250 | 813 | 31,222 |
| Depreciations | 0 | -2,640 | -1,184 | -5,805 |
| Right-of-use assets 31.12.2025 | 3,398 | 7,240 | 1539 | 33,335 |
| Lease liabilities 01.01.2025 | 3,643 | 4,922 | 2,505 | 7,559 |
| Additions | 0 | 6,884 | 1,404 | 29,605 |
| Repayments | 0 | -4,181 | -2,335 | -5,288 |
| Lease liabilities 31.12.2025 | 3,643 | 7,625 | 1574 | 31,876 |
| Leasing period | 3-5 years | 3-10 years | 3-8 years | 3-10 years |
The Group has entered into several lease agreements that are considered to qualify as short-term and/or low-value in accordance with IFRS 16. Payments associated with such short-term and low-value leases are recognised on a straight-line basis as an expense in profit or loss. Short-term leases are leases with a lease term of 12 months or less. Low-value assets comprise IT equipment and small items of office furniture. The total cost of renting equipment not categorized as ROU amounted to NOK 1,6 million in 2025.
Note 18 Other current receivables and prepayments
| (NOK thousands) | 31 Dec 2025 | 31 Dec 2024 |
|---|---|---|
| Other current prepayments | 21,018 | 22,745 |
| VAT receivable | 30,399 | 26,129 |
| Other receivables | 168 | 10 |
| Tax incentive scheme ("Skattefunn") | 0 | 2,258 |
| Total other current receivables | 51,585 | 51,142 |
| Current receivables pr 31.12.25 | 0-3 months | 4-12 months | Total |
|---|---|---|---|
| VAT receivables | 30,399 | 0 | 30,399 |
| Other receivables | 0 | 168 | 168 |
| Total other current receivables | 30,399 | 168 | 30,567 |
As of 31 December 2025 all of the Group’s other current receivables were due within one year and considered fully collectible. Accordingly, the fair value of the Group’s other current receivables was equal to nominal value, no bad debt was recognised for the years then ended, and management did not consider a provision for uncollectible accounts necessary.
As of 31 December 2025 the Group did not have any current receivables in foreign currencies, nor in 2024.
Note 19 Derivative financial instruments
Financial assets
| (NOK thousands) | 31 Dec 2025 | 31 Dec 2024 |
|---|---|---|
| Derivative financial assets | ||
| Interest rate swaps | 10,638 | 13,643 |
| Salmon price hedging | -384 | 0 |
| Total derivative financial assets | 10,254 | 13,643 |
The derivative financial assets relate to hedging contracts for the Company’s interest rate exposure and consist of interest rate swap contracts of NOK 550 million with several banks. The contracts are due in 2028 (one in 2030) and have an average swap fixed interest rate of 3.0%. Changes in market value are registered as unrealised profit/loss under financial income and allocated as unrealized profit/loss under other current receivables in the balance sheet.
In addition, in 2025 the Group entered a salmon price hedging agreement whereby the valuation is based on expected monthly cash flows calculated as the difference between the agreed fixed price and the expected market price, multiplied by the contracted volume. The cash flows are discounted using an annual WACC of ~7%. Market prices are based on forward curves from Sismaloni and calculated in NOK using an EUR/NOK exchange rate of 11.8.
The net present value of the contract as of 31 December 2025 amounts to NOK -0.4 million.
See note 3 for further description and more details on valuation method.
Note 20 Cash and restricted cash
| (NOK thousands) | 31 Dec 2025 | 31 Dec 2024 |
|---|---|---|
| Cash in bank | 159,386 | 425,818 |
| Restricted bank deposits | 4,052 | 3,644 |
| Total cash and cash equivalents | 163,438 | 429,462 |
Restricted bank deposits are related to tax withholdings for employees (NOK 4.1 million).
Note 21 Share Capital and Capital history
| Nominal value | 31 Dec 2025 | 31 Dec 2024 | |
|---|---|---|---|
| Ordinary shares | 0.05 | 462,603,306 | 462,603,306 |
| Average number of shares | 0.05 | 462,603,306 | 440,297,748 |
| (NOK thousands) | 31 Dec 2025 | 31 Dec 2024 | |
| Share capital | 23,130 | 23,130 | |
| Share premium | 2,414,997 | 2,415,049 | |
| Total | 2,438,127 | 2,438,179 | |
| The number of shares issued in the company at 31 December 2025 was 462,603,306 with a nominal value of NOK 0.05 each. All shares carry equal voting rights. | |||
| 20 largest shareholders as of 31.12.25 | No of shares | Percentage share |
|---|---|---|
| DNB Asset Management | 33,213,268 | 7.2 % |
| Ronja Capital Investment AS | 32,457,311 | 7.0 % |
| Farvatn AS | 30,696,975 | 6.6 % |
| Handelsbanken Fonder | 23,465,547 | 5.1 % |
| Dongwon Industries | 17,932,838 | 3.9 % |
| Rofisk AS | 15,204,563 | 3.3 % |
| Nordea Funds | 15,132,358 | 3.3 % |
| Kjølås Stansekniver AS | 13,173,105 | 2.8 % |
| Stette Invest AS | 12,410,954 | 2.7 % |
| Jakob Hatteland Holding AS | 10,907,805 | 2.4 % |
| Ewos AS | 9,480,984 | 2.0 % |
| Mevold Invest AS | 9,074,474 | 2.0 % |
| Lyngheim Invest AS | 8,149,252 | 1.8 % |
| Hustadlitt AS | 7,500,000 | 1.6 % |
| Bortebakken AS | 7,267,330 | 1.6 % |
| Jan Heggelund | 6,096,085 | 1.3 % |
| Bondø Invest AS | 4,614,718 | 1.0 % |
| Nordnet Livsforsikring AS | 3,403,268 | 0.7 % |
| Fosna Forvaltning AS | 3,350,000 | 0.7 % |
| AS Straen | 3,300,000 | 0.7 % |
| Total 20 largest shareholders | 266,830,835 | 57.7 % |
| Other shareholders | 195,772,471 | 42.3 % |
| Total number of shares | 462,603,306 | 100.0 % |
As of 31 December 2025, shares directly held by members of the Board of Directors, Chief Executive Officer, and Executive Management consisted of the following:
| No of shares | Percentage share | |
|---|---|---|
| Peder Stette, Member of the board - Stette Invest AS | 12,410,954 | 2.7 % |
| Vibecke Bondø, Member of the board - Bondø Invest AS | 4,614,718 | 1.0 % |
| Ingjarl Skarvøy, COO - Terra Mare AS and private | 1,800,150 | 0.4 % |
| Trond Håkon Schaug-Pettersen, CEO - Troha Invest AS | 500,000 | 0.1 % |
| Odd Frode Roaldsnes, CCO - Anno Invest AS | 275,000 | 0.1 % |
| Jan-Emil Johannessen, Member of the board - Jawendel AS | 173,333 | 0.0 % |
| Anne Breiby, Member of the board | 168,935 | 0.0 % |
| Kamilla Mordal Holo, Project Director - C10 Holding AS & private | 160,060 | 0.0 % |
| Trond Vadset Veibust, CFO - Trollkyrkja AS | 90,000 | 0.0 % |
| Vidar Skjørli, Director HR & Strategy | 6,216 | 0.0 % |
| Total | 20,199,366 | 4.4 % |
Capital History
| (NOK thousands) | Date | Capital Increase | Share Capital After Change | Par Value | Subscription price per share | New shares | Total no. of outstanding shares |
|---|---|---|---|---|---|---|---|
| Opening balance 1 July 2020 | 5,375,159 | 0.05 | 107,503,182 | ||||
| Share options exercised | 10 July 2020 | 30,000 | 5,405,159 | 0.05 | 3.33 | 600,000 | 108,103,182 |
| Private placement | 23 July 2020 | 581,395 | 5,986,554 | 0.05 | 4.30 | 11,627,906 | 119,731,088 |
| Private placement | 11 September 2020 | 5,000,000 | 10,986,554 | 0.05 | 5.00 | 100,000,000 | 219,731,088 |
| Private placement | 23 March 2021 | 4,166,667 | 15,153,221 | 0.05 | 6.00 | 83,333,333 | 303,064,421 |
| Acquisition Kraft Laks | 16 August 2021 | 109,535 | 15,262,756 | 0.05 | 7.58 | 2,190,694 | 305,255,115 |
| Private placement | 12 October 2021 | 277,068 | 15,539,824 | 0.05 | 7.71 | 5,541,374 | 310,796,489 |
| Share options exercised | 26 March 2022 | 81,250 | 15,621,074 | 0.05 | 4.80 | 1,625,000 | 312,421,489 |
| Private placement | 5 April 2022 | 1,666,667 | 17,287,741 | 0.05 | 9.00 | 33,333,333 | 345,754,822 |
| Private placement | 18 April 2023 | 3,409,091 | 20,696,832 | 0.05 | 7.70 | 68,181,818 | 413,936,640 |
| Private placement | 18 June 2024 | 2,433,333 | 23,130,165 | 0.05 | 7.50 | 48,666,660 | 462,603,300 |
The Company entered into an investment agreement with Dongwon Industries and completed a NOK 50 million private placement towards Dongwon Industries in July 2020.
The Company raised NOK 500 million in a private placement in connection with its initial public offering related to the admission on Merkur Market (now Oslo Børs) in September 2020. Further, the Company also raised another NOK 500 million in a private placement in March 2021.
In August 2021 the Company acquired 100% of the shares in Kraft Laks AS. As part of the settlement the Company issued 2,190,694 new shares of NOK 7.5775 per share, and thereby increased its equity by NOK 16.6 million. In October 2021 the Company carried out a private placement of USD 5m (NOK ~43m) towards Cargill.
Further, in April 2022 the Company carried out a private placement raising gross proceeds of
NOK 300 million at a subscription price of NOK 9.00 per share, bringing total raised equity to more than NOK 1.7 billion.
In April 2023 the Company carried out a private placement raising gross proceeds of NOK 525 million at a subscription price of NOK 7.7 per share, bringing total raised equity to more than NOK 2.2 billion.
In June 2024 the Company carried out a private placement raising gross proceed of NOK 365 million at a subscription price of NOK 7.5 per share, bringing total raised equity to more than NOK 2.5 billion.
Note 22 Interest bearing debt
| Long-term interest bearing debt | ||
|---|---|---|
| (NOK thousands) | 31.12.2025 | 31.12.2024 |
| Debt to credit institutions | 1,545,228 | 569,100 |
| Leasing liabilities | 30,088 | 9,668 |
| Total long-term interest-bearing debt | 1,575,316 | 578,768 |
| Short-term interest bearing debt | ||
|---|---|---|
| (NOK thousands) | 31.12.2025 | 31.12.2024 |
| Debt to credit institutions | 334,571 | 158,488 |
| Leasing liabilitites | 10,987 | 5,317 |
| Total short-term interest-bearing debt | 345,558 | 163,805 |
| Total interest-bearing debt | 1,920,874 | 742,573 |
| Cash & cash equivalents | 163,438 | 429,462 |
| Net interest-bearing debt | 1,757,436 | 313,111 |
In June 2024 the Group expanded its existing senior secured debt financing package related to Indre Harøy Phase 1 and 2, from 1,550 NOKm to 2,225 NOKm. In June 2025 the Group entered credit facility of up to 250 NOKm with DNB and Nordea Bank to strengthen the Company’s financial flexibility. This facility was amended during the quarter, and the entire facility is available to support operations at Indre Harøy and ongoing phase 2 investments. Simultaneously in June the Company also increased its overdraft facility in connection with the Indre Harøy operation from 150 NOKm to 200 NOKm.
As per 31 December 2025, 1,527 NOKm was drawn of the secured green debt financing package. In addition, the Group has drawn 198 NOKm, of the 200 NOKm available under the Overdraft Facility.
The Group has also entered into loan agreements for a total of NOK 60 million relating to Salmon Evolution Dale AS of which around NOK 49 million was drawn as per 31 December 2025. This loan is for financing of working capital, investments in Salmon Evolution Dale as well as refinancing of the seller’s credit from the acquisition of Salmon Evolution Dale AS. For 2025 the above table does not include other long-term liabilities of NOK 3.6 million related to water rights in Salmon Evolution Dale AS.
The loans are floating interest rate loans denominated in NOK with an interest charge based on NIBOR 3M plus an agreed margin.
Financial covenants
The most important financial covenants for the long-term financing of the Group are, respectively, a solvency requirement that the borrower’s (Salmon Evolution Norway AS) book equity ratio (including intra-group loans) shall be minimum 45%. Further, there is a profitability requirement linked to the borrower’s EBITDA which shall be greater than NOK 250 million on a last 12-month basis from Q2 2027. Quarterly EBITDA figures were measured from Q2 2024 with set minimum EBITDA levels reflecting the Group’s gradual ramp up of production volumes and profitability.
Finally, there is a minimum cash requirement that stipulates that the obligors (Salmon Evolution Norway AS, Salmon Evolution Sales AS and Salmon Evolution ASA) cash balance shall be greater than NOK 100 million at any time. Any undrawn and available amounts under the revolving facility and the overdraft is included in the calculation of the cash balance.
Reflecting the softer than expected salmon market over the last 12 months, the Company has agreed with its lenders to amend the EBITDA covenant requirements through 2025.
Security
The Group’s bank debt facilities are fully guaranteed by Salmon Evolution ASA. The respective lenders also have a pledge over 100% of the shares in the borrower, Salmon Evolution Norway AS and Salmon Evolution Dale AS. Furthermore, the respective lenders have a pledge over all material operating assets of the Group, hereunder inter alia, land, plant and machinery, operating licenses, inventory and receivables.
| Information supporting the cash flows | Interest bearing debt | |
|---|---|---|
| (NOK thousands) | Short term | Long term |
| Balance at January 1, 2024 | 107,625 | 586,859 |
| Repayment of loans and borrowings | 0 | -869 |
| Proceeds from new bank loan | 55,213 | 0 |
| Change in obligations due to land and water rights | 0 | -5,059 |
| Change in lease liabilities* | 968 | 1,480 |
| Balance at Dec 31, 2024 | 163,805 | 582,411 |
| Repayment of loans and borrowings | -300 | -900 |
| Proceeds from new bank loan | 176,383 | 977,028 |
| Change in lease liabilities* | 5,670 | 20,420 |
| Balance at Dec 31, 2025 | 345,558 | 1,578,959 |
*See note 17 for more information about leases
Note 23 Trade and other current liabilities
Trade payables
| (NOK thousands) | 31 Dec 2025 | 31 Dec 2024 |
|---|---|---|
| Trade payables operation | 93,590 | 98,527 |
| Trade payable constructions | 98,457 | 94,857 |
| Total trade payables | 192,047 | 193,384 |
Social security and other taxes
| (NOK thousands) | 31 Dec 2025 | 31 Dec 2024 |
|---|---|---|
| Payroll withholding tax | 4,047 | 3,641 |
| Employer's national insurance contributions | 3,480 | 3,439 |
| Total social security and other taxes | 7,527 | 7,080 |
Other current liabilities
| (NOK thousands) | 31 Dec 2025 | 31 Dec 2024 |
|---|---|---|
| Accrued salaries, holiday pay and bonus provisions | 11,302 | 9,846 |
| Accrued interest expense | 17,540 | 4,562 |
| Total other current liabilities | 28,842 | 14,408 |
Note 24 Related party balances and transactions
During the ordinary course of business, the Group engages in certain transactions with related parties. The following is a summary of related party transactions carried out in the period:
The Group has a consultancy agreement with Stette Eiendom AS (Peder Stette, board member) relating to assistance in certain projects on an ad-hoc basis.
The Group has during 2025 purchased legal services from Adviso Advokatfirma AS in the amount of NOK 5,000 (55,000 in 2024) in its ordinary course of business. Board member Ingvild Vartdal is a partner at Adviso Advokatfirma AS but has not had any role in the services rendered to Salmon Evolution.
Income from related parties
| (NOK thousands) | 2025 | 2024 |
|---|---|---|
| K Smart Co Ltd (AC) | 0 | 2,047 |
| Total income from related parties (incl.VAT) | 0 | 2,047 |
Expenses to related parties (incl. VAT)
| (NOK thousands) | 2025 | 2024 |
|---|---|---|
| Adviso Advokatfirma AS (Board member) | 5 | 55 |
| Kjølås Stansekniver AS (Nomination committee) | 0 | 181 |
| Stette Eiendom AS (Board member) | 60 | 0 |
| Ronja Capital Investment AS (Chair of the board) | 0 | 828 |
| Total expenses to related parties (Incl. VAT) | 65 | 1,064 |
Current receivables from related parties
| (NOK thousands) | 2025 | 2024 |
|---|---|---|
| K Smart Farming Co., Ltd (AC) | 0 | 14,834 |
| Total current receivables to related parties | 0 | 14,834 |
Non-current receivables from related parties
| (NOK thousands) | 2025 | 2024 |
|---|---|---|
| K Smart Farming Co., Ltd (AC) | 13,169 | 0 |
| Total current receivables to related parties | 13,169 | 0 |
Note 25 Climate risk
Climate risks may affect both production and financial performance through physical and transitional risk.
Physical Risks
Although the company operates in closed systems, its operations may still be impacted by changes in weather and temperature conditions. Climate change could lead to rising water temperatures, which in turn may affect water quality. As the operation is land-based, the company already closely monitors and controls water quality, which helps minimise the potential negative effects of changes in water temperature.
Furthermore, extreme weather events, such as heavy rainfall, storms, or flooding, could cause operational disruptions, infrastructure damage, and increased maintenance costs, which may affect production. During the design and construction of the facility, physical climate risks were taken into consideration, and contingency plans have been implemented to minimise potential disruptions to operations.
Transitional Risks
Transitional risks include regulatory changes and requirements, as well as shifts in consumer behavior, which could impact the group’s operational and financial performance. The company is actively working to reduce its carbon footprint through energy efficiency measures and circular production processes. The growing demand for sustainable farmed salmon is seen as an opportunity rather than a risk, and the company is well-positioned to meet this demand.
Accounting Implications
In accordance with IFRS, the company considers climate risks as part of its asset and liability valuations. Based on the current assessment of climate risks, the company has concluded that these risks do not currently have a material impact on the financial statements. Necessary investments in technology and compliance with evolving regulations are considered manageable within the company’s existing capital structure. No immediate need for asset impairments or other significant adjustments to the financial statements due to climate risks has been identified.
The company will continue to monitor the development of climate risks and make any necessary adjustments to ensure long-term sustainable operations and compliance with all regulatory requirements. The group is committed to aligning with climate risk reporting standards. For more information on how we manage climate risks and minimize their impact, please refer to our ESG report.
Note 26 Events after the reporting date
No material subsequent events.
Salmon Evolution ASA Financial statements
Statement of profit or loss
| (NOK thousands) | Note | 2025 | 2024 |
|---|---|---|---|
| Other income | 3 | 34,272 | 33,244 |
| Total operating revenue | 34,272 | 33,244 | |
| Personnel expenses | 4,5 | -53,290 | -49,343 |
| Depreciation | 6,7 | -5,201 | -3,499 |
| Other operating expenses | 4,8 | -19,791 | -24,858 |
| Operating profit (EBIT) | 4,8 | -44,009 | -44,455 |
| Financial income | 3 | 144,605 | 128,021 |
| Financial expenses | 3,9 | -27,464 | -12,120 |
| Net financials | 117,140 | 115,901 | |
| Profit/loss before tax | 73,131 | 71,446 | |
| Income tax expense | 10 | -15,518 | 0 |
| Profit/loss for the period | 57,613 | 71,446 | |
| Statement of Comprehensive Income | |||
| (NOK thousands) | Note | 2025 | 2024 |
| Profit/loss for the period | 57,613 | 71,446 |
Statement of financial position
| (NOK thousands) | Note | 31 Dec 2025 | 31 Dec 2024 |
|---|---|---|---|
| Assets | |||
| Intangible assets | 6 | 9,088 | 8,382 |
| Deferred tax asset | 10 | 3,891 | 3,891 |
| Property, plant & equipment | 6 | 16,851 | 18,754 |
| Right-of-use assets | 6,7 | 7,520 | 5,949 |
| Group non-current receivables | 3 | 1,665,923 | 1,307,354 |
| Investment in subsidiaries | 11 | 859,694 | 859,438 |
| Total non-current assets | 2,562,967 | 2,203,769 | |
| Other current receivables | 3 | 208,633 | 174,910 |
| Cash and cash equivalents | 12 | 243,713 | 397,819 |
| Total current assets | 452,346 | 572,729 | |
| Total assets | 3,015,314 | 2,776,498 | |
| Equity and liabilities | |||
| Share capital | 13 | 23,130 | 23,130 |
| Share premium | 13 | 2,450,459 | 2,450,459 |
| Other reserves | 5 | 12,530 | 10,703 |
| Other equity | 0 | 0 | |
| Retained earnings | 159,394 | 101,781 | |
| Total equity | 2,645,513 | 2,586,073 | |
| Long-term interest bearing debt | 9 | 25,000 | 25,000 |
| Lease liabilities - long term | 7 | 4,117 | 3,353 |
| Total non-current liabilities | 29,117 | 28,353 | |
| Short-term interest bearing debt | 9 | 303,253 | 145,018 |
| Trade payables | 14 | 3,626 | 2,041 |
| Current liabilities to Group Companies | 3 | 892 | 1,415 |
| Deferred tax | 10 | 15,518 | 0 |
| Lease liabilities - short term | 7 | 3,797 | 2,955 |
| Other current liabilities | 14 | 13,598 | 10,643 |
| Total current liabilities | 340,684 | 162,072 | |
| Total liabilities | 369,800 | 190,425 | |
| Total equity and liabilities | 3,015,314 | 2,776,498 |
The Board of Directors of Salmon Evolution ASA
Elnesvågen/Ålesund 27 April 2026
Tore Tønseth
Chair
Peder Stette
Director
Anne Breiby
Director
Ingvild Vartdal
Director
Vibecke Bondø
Director
Jan-Emil Johannessen
Director
Eunhong Min
Director
Trond Håkon Schaug-Pettersen
CEO
Statement of cash flows
| (NOK thousands) | Note | 2025 | 2024 |
|---|---|---|---|
| Cash flow from operations | |||
| Profit before income taxes | 73,131 | 71,446 | |
| Adjustments for: | |||
| Depreciation | 6 | 5,201 | 3,499 |
| Net financials | 3 | -117,140 | -115,901 |
| Share based payment expenses | 4 | 1,621 | 726 |
| Changes in working capital: | |||
| Change in trade receivables | 8,358 | -6,965 | |
| Change in other current recievables | -54,234 | -46,426 | |
| Change in current liabilities to Group companies | 3 | 0 | -2,061 |
| Change in other current liabilities | -112 | -352 | |
| Cash generated from operations | -83,175 | -96,034 | |
| Cash flow from investment activities | |||
| Investment in Group Companies | 11 | -51 | -500,000 |
| Payments for intangible assets | 6 | -1,956 | -2,893 |
| Proceeds from government grants | 0 | 346 | |
| Payments for fixed assets and other capitalizations | 6 | 1,506 | -18,226 |
| Financial income received | 6,225 | 35,045 | |
| Net cash flow from investment activities | 5,723 | -485,728 | |
| Cash flow from financing activities | |||
| Proceeds from issue of equity, net of paid transaction costs | 13 | 0 | 349,425 |
| Proceeds from intercompany borrowings | 3 | -207,020 | 213,000 |
| Proceeds from new borrowings | 9 | 158,235 | 54,949 |
| Repayment of borrowings | 9 | 0 | 0 |
| Payments of principal portion of lease liabiities | -3,471 | -3,096 | |
| Interest paid lease liabilities | -517 | -158 | |
| Financial expences paid | -23,880 | -11,966 | |
| Net cash flow from financing activities | -76,654 | 602,154 | |
| Net change in cash and cash equivalents | -154,106 | 20,392 | |
| Cash and cash equivalents at the beginning of the period | 397,819 | 377,427 | |
| Cash and cash equivalents at the end of the period | 243,713 | 397,819 |
Statement of changes in equity
| (NOK thousands) | Note | Share capital | Share premium | Retained Earnings | Other Reserves | Total equity |
|---|---|---|---|---|---|---|
| Balance at 1 January 2024 | 20,697 | 2,103,467 | 30,335 | 9,978 | 2,164,476 | |
| Profit/loss for the period | 0 | 0 | 71,446 | 0 | 71,446 | |
| Other comprehensive income | 0 | 0 | 0 | 0 | 0 | |
| Total comprehensive income | 0 | 0 | 71,446 | 0 | 71,446 | |
| Private placement June 2024 | 2,433 | 362,567 | 0 | 0 | 365,000 | |
| Private placement, transaction costs | 0 | -15,575 | 0 | 0 | -15,575 | |
| Share options issued | 0 | 0 | 0 | 0 | 0 | |
| Share based payment expensed | 0 | 0 | 0 | 726 | 726 | |
| Transactions with owners | 13 | 2,433 | 346,992 | 0 | 726 | 350,151 |
| Balance at 31 December 2024 | 13 | 23,130 | 2,450,459 | 101,781 | 10,704 | 2,586,073 |
| Profit/loss for the period | 0 | 0 | 57,613 | 0 | 57,613 | |
| Other comprehensive income | 0 | 0 | 0 | 0 | 0 | |
| Total comprehensive income | 0 | 0 | 57,613 | 0 | 57,613 | |
| Share options issued | 0 | 0 | 0 | 0 | 0 | |
| Share based payment expensed | 0 | 0 | 0 | 1,827 | 1,827 | |
| Transactions with owners | 13 | 0 | 0 | 0 | 1,827 | 1,827 |
| Balance at 31 December 2025 | 13 | 23,130 | 2,450,459 | 159,394 | 12,530 | 2,645,513 |
Note 1 Summary of significant accounting policies
General information
Salmon Evolution ASA is a Norwegian business headquartered in Hustadvika, Møre og Romsdal and listed on the Oslo Børs with the ticker symbol “SALME”. Salmon Evolution ASA owns the following subsidiaries (collectively “the Group” or “SE”);
- Salmon Evolution Norway AS, headquartered and located in Elnesvågen, Norway
- Salmon Evolution International AS
- Salmon Evolution Dale AS
- Salmon Evolution Sales AS
- Salmon Evolution Technology AS
SE is in the process of constructing a land-based salmon farming facility with a planned annual harvesting capacity of 36,000 tonnes HOG. The build-out is expected to be in three phases, with the first phase expected to consist of build out of land acquisition, building of foundation, water pumps supporting all three phases and build out of 12 grow out tanks and hatchery. SE operates a hybrid flow-through system ("HFS"), replacing the water every four hours with clear and fresh water from the Norwegian coast. Construction of phase 1 began in Q1 2020 with completion in Q2 2023. Production started at the end of Q1 2022 when the first smolt entered the first tank with first harvest late Q4 2022. Phase 2 consists of build out of an additional 12 grow out tanks with first smolt expected entered in H1 2026. The last construction phase, phase 3, consists of build-out of an additional 24 grow out tanks.
Basis of preparation and accounting principles
The financial statements of the Company have been prepared in accordance with the Norwegian Accounting Act § 3-9 and Finance Ministry’s prescribed regulations from 21 January 2008 on simplified IFRS. Principally this means that recognition and measurement comply with IFRS® International Accounting Standards and presentation and note disclosures are in accordance with the Norwegian Accounting Act and generally accepted accounting principles. Any exceptions from measurement and recognition according to IFRS are disclosed below.
Accounting period
The company was incorporated on 3 July 2020. The accounting period for the financial statements is 1 January 2025 - 31 December 2025.
Going concern
The Company has adopted the going concern basis in preparing its financial statements. When assessing this assumption, management has assessed all available information about the future. This comprises information about net cash flows from existing customer contracts and other service contracts, debt service and obligations. After making such assessments, management has a reasonable expectation that the Company has adequate resources to continue its operational existence for the foreseeable future.
Accounting policies
There are no new standards that have been applied in 2025 with significant effect on the financial statements.
The IASB has issued IFRS 18 Presentation and Disclosure in Financial Statements, which replaces IAS 1 and introduces new requirements for the presentation of financial performance and enhanced disclosures. IFRS 18 is effective for annual reporting periods beginning on or after 1 January 2027 and is required to be applied retrospectively (with restatement of comparative information). The Company is currently assessing the impact of IFRS 18 and expects the main effects to relate to presentation and disclosure in the financial statements and notes; the standard is not expected to impact recognition and measurement
Basis of measurement
The financial statements have been prepared under the historical cost basis.
Investments in subsidiaries
Investments in subsidiaries are valued at cost in the company accounts. The investment is valued as cost of acquiring shares, providing they are not impaired. An impairment loss is recognised for the amount by which the carrying amount of the subsidiary exceeds its recoverable amount. The recoverable amount is the higher of fair value less cost to sell and value in use. The recoverable amount of an investment in a subsidiary would normally be based on the present value of the subsidiary’s future cash flow.
Classification of current and non-current items
Assets are classified as current when they are expected to be realized or sold, or to be used in the Company’s normal operating cycle or falls due or is expected to be realized within 12 months after the end of the reporting date. Assets that do not fall under this definition are classified as non-current. Liabilities are classified as current when they are expected to be settled in the normal operating cycle of the Company or are expected to be settled within 12 months after the reporting date, or if the Company does not have an unconditional right to postpone settlement for at least 12 months after the reporting date. Liabilities that do not fall under this definition are classified as non-current.
Employee benefits
Liabilities for wages and salaries, including non-monetary benefits, annual leave and accumulating sick leave that are expected to be settled wholly within 12 months after the end of the period in which the employees render the related service are recognised in respect of employees’ services up to the end of the reporting period and are measured at the amounts expected to be paid when the liabilities are settled. The liabilities are presented as current employee benefit obligations in the balance sheet.
Share based payments
Information relating to the Company’s employee option scheme is set out in note 5. The fair value of options granted under the scheme is recognised as an employee benefits expense with a corresponding increase in equity. The total amount to be expensed is determined by reference to the fair value of the options granted:
- including any market performance conditions (e.g. the entity’s share price)
- excluding the impact of any service and non-market performance vesting conditions (e.g. profitability, sales growth targets and remaining an employee of the entity over a specified time period), and
- including the impact of any non-vesting conditions (e.g. the requirement for employees to save or hold shares for a specific period of time).
The total expense is recognised over the vesting period, which is the period over which all of the specified vesting conditions are to be satisfied. At the end of each period, the entity revises its estimates of the number of options that are expected to vest based on the non-market vesting and service conditions. It recognises the impact of the revision to original estimates, if any, in profit or loss, with a corresponding adjustment to equity.
Pensions
The Group offers a defined contribution plan to its employees and pays contributions to publicly or privately administered pension insurance plans on a mandatory, contractual, or voluntary basis. The Group has no further payment obligations once the contributions have been paid. Contributions are recognized as employee benefit expense when they are due and are included as part of salary and personnel costs in the statement of profit and loss.
Current and change in deferred tax for the year
Income Tax
The tax expense represents the sum of the tax currently payable and change in deferred tax.
Current tax
Current and deferred tax are recognized in profit or loss, except when they relate to items that are recognized in other comprehensive income or directly in equity, in which case, the current and deferred tax are also recognized in other comprehensive income or directly in equity respectively.
Deferred tax
Deferred tax is the tax expected to be payable or recoverable on differences between the carrying amounts of assets and liabilities in the financial statements and the corresponding tax bases used in the computation of taxable profit and is accounted for using the balance sheet liability method. Deferred tax liabilities are generally recognised for all taxable temporary differences and deferred tax assets are recognized to the extent that it is probable that taxable profits will be available against which deductible temporary differences can be utilized.
Leases
All leasing agreements with a duration exceeding 12 months are capitalized. The Group assesses whether a legally enforceable contract is or contains a lease at the inception date of the contract. The assessment includes several criteria to be determined based on judgment that includes whether there is an identifiable asset in connection with the lease, whether the Group has the right to control the use of the identifiable asset, and whether the Group can obtain substantially all economic benefits from the identifiable asset.
The Company recognizes a right-of-use (“ROU”) asset and a lease liability at the lease commencement date. The lease liability is calculated based on the present value of the contractual minimum lease payments using the incremental interest rate of the lease. The contractual minimum lease payments consist of fixed payments based on contractual amount at the time of conclusion of the agreement. The lease liability is subsequently measured at amortized cost under the effective interest rate during the lease term and may also be adjusted to management’s reassessment of future lease payments based on options exercised, renegotiations, or changes of an index rate.
The ROU asset is calculated based on the lease liability, plus initial direct costs towards the lease, and less any incentives granted by the lessor. The ROU asset is subsequently amortized under the straight-line method under the shorter of the lease term or the useful life of the underlying asset and is included as part of depreciation and amortization in the accompanying statements of other comprehensive income.
Leases that fall under the IFRS 16 short-term exception are recognized on a straight-line basis over the lease term.
Cash and cash equivalents
For the purpose of presentation in the statement of cash flows, cash and cash equivalents include cash on hand and deposits held at call with financial institutions.
Trade and Other Receivables
Trade receivables are initially recognized at amortized cost, less a provision for expected credit losses. Credit loss provisions are based on individual customer assessments over each reporting period and not on a 12-month period.
Trade and other payables
Trade and other payables represent unpaid liabilities for goods and services provided to the Company prior to the end of the financial year and are presented as current liabilities unless payment is not due within 12 months after the reporting period. Trade and other payables are recognized initially at their fair value and are subsequently measured at amortized cost using the effective interest method.
Statement of cash flows
The accompanying statements of cash flows are prepared in accordance with the indirect method.
Note 2 Financial risk and capital management
The Company’s financial assets and liabilities include trade and other receivables, trade and other payables, cash, and borrowings necessary for its operations. The Company’s risk management is carried out by the Company’s finance department. The Group is exposed to market risk, credit risk, and liquidity risk.
Market risk
Market risk is linked to both Interest Rate- and Currency fluctuations.
Interest Rate
The Company's interest rate risk relates primarily to borrowings from financial institutions with variable interest rates. As of 31 December 2025, Salmon Evolution Norway AS, a subsidiary of Salmon Evolution ASA, has outstanding loans from credit institutions amounted to NOK 1,681 million (excluding financial leasing). The Construction Facility, which represents the vast majority of the Company’s loans with financial institutions, has an interest rate of NIBOR 3M plus an agreed margin. To reduce exposure to fluctuations in the interest rate Salmon Evolution Norway AS has entered interest rate swap contracts of NOK 550 million with several banks. Salmon Evolution ASA is guarantor for the loan.
The Construction Facility and the Term Loan Facility are partly guaranteed by Eksfin.
Foreign Currency
The Company’s foreign currency risk relates to the Company’s operating, investing, and financing activities denominated in a foreign currency. This includes the Company’s revenues, expenses and capital expenditures. As of 31 December 2025 the Company had not made any contracts.
The Company’s presentation currency is Norwegian Kroner (“NOK”).
Credit risk
With respect to credit risk arising from the financial assets of the Company, which comprise cash and cash equivalents, and other receivables, the Company’s exposure to credit risk arises from default of the counterparty, with a maximum exposure equal to the carrying amount of these instruments. This risk is not considered to be material.
Liquidity risk
A lack of liquidity will entail a risk that the Company will not be able to pay its obligations on maturity. Management monitors rolling forecasts of the Company’s liquidity reserve (comprising cash and cash equivalents) based on expected cash flows. The Company’s business plan and growth strategy is capital intensive, and the Company may be dependent upon future equity issues and/or debt financing to finance its current long-term plans.
Note 3 Intercompany balances and intercompany transactions
Intercompany balances 31.12.2025
| (NOK thousands) | Non-current receivables | Current receivables | Non-current liabilities | Current liabilities |
|---|---|---|---|---|
| Salmon Evolution Norway AS | 1,598,889 | 4,660 | 0 | 873 |
| Salmon Evolution International AS | 35,717 | 0 | 0 | 0 |
| Salmon Evolution Dale AS | 17,147 | 0 | 0 | 0 |
| Salmon Evolution Sales AS | 1,000 | 0 | 0 | 19 |
| K Smart Farming Co., Ltd (related party) | 13,169 | 0 | 0 | 0 |
| Total intercompany balances | 1,665,923 | 4,660 | 0 | 936 |
Intercompany balances 31.12.2024
| (NOK thousands) | Non-current receivables | Current receivables | Non-current liabilities | Current liabilities |
|---|---|---|---|---|
| Salmon Evolution Norway AS | 1,265,971 | 9,317 | 0 | 919 |
| Salmon Evolution International AS | 33,108 | 0 | 0 | 0 |
| Salmon Evolution Dale AS | 7,275 | 534 | 0 | 0 |
| Salmon Evolution Sales AS | 1,000 | 0 | 0 | 81 |
| K Smart Farming Co., Ltd (related party) | 0 | 14,834 | 0 | 0 |
| Total intercompany balances | 1,307,354 | 24,685 | 0 | 956 |
Intercompany and related party transactions
| (NOK thousands) | Revenue | Interest |
|---|---|---|
| Salmon Evolution Norway AS | 33,622 | 112,919 |
| Salmon Evolution International AS | 0 | 2,609 |
| Salmon Evolution Dale AS | 665 | 872 |
| Salmon Evolution Sales AS | 0 | 0 |
| K Smart Farming Co., Ltd (related party) | 0 | 0 |
| Total intercompany transactions | 34,287 | 116,399 |
Investments in Salmon Evolution Norway AS and Salmon Evolution International AS is partly financed with loan from Salmon Evolution ASA. The interest rate on these loans is set at an interest rate of 3 months Nibor + a margin of 3%.
Intercompany receivables to Salmon Evolution Norway AS are unsecured. The bank loans have security in all material assets of Salmon Evolution Norway AS, including but not limited to land and plant and machinery. Salmon Evolution ASA as parent company of the Group has also fully guaranteed the Group’s bank loans.
Carrying value of the investment property pledged as security is NOK 3,577 million.
Salmon Evolution ASA also requires an administration fee from group companies. This fee covers administration, advice and development of the company, and is invoiced based on time spent by the employees of the parent company in the various areas. Total amount in 2025 was NOK 34.3 million (NOK 30.7 million in 2024).
There were no other significant transactions with group companies and related parties in 2025.
Note 4 Personnel expenses, remuneration to the board and auditor's fee
| Personnel expenses, remuneration to executives and accrued liabilities to be paid in 2025 | ||
|---|---|---|
| (NOK thousands) | 2025 | 2024 |
| Salaries | 38,570 | 37,472 |
| Social security | 6,376 | 6,379 |
| Pensions | 2,169 | 2,054 |
| Other benefits | 1,396 | 1,176 |
| Share-based payments | 1,621 | 726 |
| Director's fee (both paid in 2024 and liabilities to be paid 2025) | 3,158 | 2,893 |
| Gross personnel expenses | 53,290 | 50,699 |
| - Capitalized costs | 0 | -1,356 |
| Total personnel expenses recognized in P&L | 53,290 | 49,343 |
| Number of full-time employment equivalents | 33 | 34 |
Norwegian entities are obligated to establish a mandatory company pension. This obligation is fulfilled under the current pension plan. No loans or guarantees have been given to the members of the board of directors or executive management.
For personnel expenses and remuneration to the board please see group note 8 and our remuneration report for 2025, published on our website salmonevolution.no.
Auditor's remuneration
| (NOK thousands) | 2025 | 2024 |
|---|---|---|
| Statutory audit | 571 | 1018 |
| Service in relation to tax return | 60 | 0 |
| Other services | 8 | 278 |
| Total | 638 | 1,296 |
Note 5 Share based payments
In 2024 the Board of directors granted a tranche of stock options. Each option gave the holder the right to subscribe or purchase shares in Salmon Evolution at an average agreed exercise price of NOK 8.30. The options were granted on 18 September for both executive management and key employees. 1/3 of the options can be exercised at earliest 12 months, 1/3 of the options can be exercised after 24 months, and 1/3 of the options can be exercised after 36 months, after the grant date. To account for this, an adjusted Black & Scholes option-pricing model is used by applying a weighted expected average life of 18 months.
Furthermore, in 2025 the Board of directors granted another tranche of stock options. Each option gives the holder the right to subscribe or purchase shares in Salmon Evolution at an average agreed exercise price of NOK 6.0. The options were granted on 27 August for both executive management and key employees. 1/3 of the options can be exercised at earliest 12 months, 1/3 of the options can be exercised after 24 months, and 1/3 of the options can be exercised after 36 months, after the grant date. To account for this, an adjusted Black & Scholes option-pricing model is used by applying a weighted expected average life of 18 months.
The fair value of the options is set on the grant date and is expensed over its lifetime. The fair value of the options has been calculated using the adjusted Black & Scholes option-pricing model, which takes into account the exercise price, the term of the option, the share price at the grant date, expected price volatility of the underlying share, expected dividend and risk-free rates. Given the recent listing and lack of historical price and volatility data, the expected volatility is based on historical volatility for a selection of comparable companies listed on Oslo Stock Exchange ("Oslo Børs"). The risk-free interest rate is set to equal the interest on Norwegian government bonds with the same maturity as the option. Average key assumptions are listed below.
| Outstanding options (NOK thousands) | 2025 | 2024 |
|---|---|---|
| Outstanding options 1 January | 10,940 | 7,060 |
| Options granted | 4,535 | 3,880 |
| Options exercised | 0 | 0 |
| Options forfeited | 403 | 0 |
| Outstanding options at end of period | 15,072 | 10,940 |
| (NOK thousands) | 2025 | 2024 |
|---|---|---|
| Charges to income statement, Salmon Evolution ASA | 1,621 | 576 |
| Charges to the shares in Salmon Evolution Norway AS | 168 | 120 |
| Charges to the shares in Salmon Evolution Dale AS | 37 | 29 |
| Key assumptions | 2025 | 2024 |
|---|---|---|
| Average fair value (NOK) | 0.83 | 1.10 |
| Average exercise price (NOK) | 6.00 | 7.50 |
| Weighted expected average life (in years) | 5.0 | 5.0 |
| Estimated dividend per share (NOK) | 0 | 0 |
| Expected average volatility | 25.8 % | 26.9 % |
| Risk-free rate | 4.04 % | 3.62 % |
Note 6 Property, plant, equipment, right-of-use assets and intangible assets
| (NOK thousands) | Intangible assets | Assets under construction | Fixtures and fittings | Right-of-use assets | Total |
|---|---|---|---|---|---|
| Cost 1 January 2025 | 8,382 | 18,162 | 1,298 | 13,804 | 41,646 |
| Additions | 1,956 | -1,667 | 161 | 5,124 | 5,575 |
| Disposals | 0 | 0 | 0 | 0 | 0 |
| Cost 31 December 2025 | 10,338 | 16,495 | 1,459 | 18,928 | 47,220 |
| Accumulated depreciation 1 January 2025 | 0 | 0 | 705 | 7,855 | 8,561 |
| Depreciation for the period | 1,250 | 0 | 398 | 3,553 | 5,201 |
| Net book value 31 December 2025 | 9,088 | 16,495 | 356 | 7,520 | 33,459 |
| Estimated lifetime | n/a | n/a | 3-5 years | 3-5 years | |
| Depreciation method | n/a | n/a | Linear | Linear |
| (NOK thousands) | Intangible assets | Assets under construction | Fixtures and fittings | Right-of-use assets | Total |
|---|---|---|---|---|---|
| Cost 1 January 2024 | 5,835 | 0 | 1,234 | 12,973 | 20,042 |
| Additions | 3,806 | 18,162 | 64 | 831 | 22,862 |
| Disposals | -1,259 | 0 | 0 | 0 | -1,259 |
| Cost 31 December 2024 | 8,382 | 18,162 | 1,298 | 13,804 | 41,646 |
| Accumulated depreciation 1 January 2024 | 0 | 0 | 399 | 4,664 | 5,062 |
| Depreciation for the period | 0 | 0 | 307 | 3,192 | 3,499 |
| Net book value 31 December 2024 | 8,382 | 18,162 | 593 | 5,950 | 33,086 |
| Intangible Assets | 01.01.2025 | Additions | Grants | Depreciation | 31.12.2025 |
|---|---|---|---|---|---|
| Skattefunn-project | 2,805 | 1,950 | 0 | 0 | 4,754 |
| Other research and development projects | 2,267 | 0 | 0 | -1,250 | 1,017 |
| Protection rights | 3,311 | 7 | 0 | 0 | 3,318 |
| Total | 8,382 | 1,956 | 0 | -1,250 | 9,088 |
Straight-line depreciation is applied over the useful life of property, plant, and equipment based on the asset’s historical cost and estimated residual value at disposal. Depreciation is charged to expense when the property, plant or equipment is ready for use or placed in service.
Capitalised development costs are related to building strategy and purchase of rights for sale and development of own branding.
The company has also activated costs for a development project with grants (SkatteFUNN) from The Research Council of Norway to improve the quality of landbased salmon. Total cost for this project in 2025 was NOK 3.4 million (3.7 million in 2024. Grants for 2025 are estimated to NOK 0.4 million (0.7 million in 2024)).
Note 7 Leases
| Amounts recognised in the balance sheet | ||
|---|---|---|
| (NOK thousands) | 31 Dec 2025 | 31 Dec 2024 |
| Right-of-use assets | ||
| Rent of premises | 5,714 | 4,630 |
| Car | 1,132 | 421 |
| Office supply | 674 | 899 |
| Total right-of-use assets | 7,520 | 5,949 |
| Lease liabilities | ||
| Current | 3,797 | 2,955 |
| Non-current | 4,117 | 3,353 |
| Total lease liabilities | 7,914 | 6,307 |
| Amounts recognised in the statement of profit or loss | ||
|---|---|---|
| (NOK thousands) | 31 Dec 2025 | 31 Dec 2024 |
| Depreciation right-of-use assets | ||
| Rent of premises | -2,710 | -2,149 |
| Car | -612 | -561 |
| Office supply | -231 | -482 |
| Gross depreciation | -3,553 | -3,192 |
| - Capitalized as assets under construction | 0 | 0 |
| Net depreciation | -3,553 | -3,192 |
| Leasing period | 3-5 years | 3-5 years |
| Interest expense lease liability | 517 | 158 |
The total cash outflow for leases in 2025 was NOK 4.0 million (NOK 3.3 million in 2024).
The Company has entered into several lease agreements that are considered to qualify as short-term and/or low-value in accordance with IFRS 16. Payments associated with such short-term and low-value leases are recognised on a straight-line basis as an expense in profit or loss. Short-term leases are leases with a lease term of 12 months or less. Low-value assets comprise IT-equipment and small items of office furniture.
Note 8 Other operating expenses
| (NOK thousands) | 2025 | 2024 |
|---|---|---|
| Cost of premises (not defined as RoU) | 1,283 | 1,455 |
| Other operating and administrative expenses | 11,627 | 13,379 |
| Insurance | 893 | 841 |
| Consultancy fees | 4,628 | 7,909 |
| Other fees (Oslo Børs, VPS) | 1,359 | 1,275 |
| Total other operating expenses | 19,791 | 24,858 |
Note 9 Debt
Long-term interest bearing debt
| (NOK thousand) | 31.12.2025 | 31.12.2024 |
|---|---|---|
| Debt to credit institutions | 25,000 | 25,000 |
| Other long-term interest bearing debt | 0 | 0 |
| Leasing liabilities | 4,117 | 3,353 |
| Total long-term interest-bearing debt | 29,117 | 28,353 |
Short-term interest bearing debt
| (NOK thousand) | 31.12.2025 | 31.12.2024 |
|---|---|---|
| Debt to credit institutions | 105,000 | 145,018 |
| Other short-term interest bearing debt | 198,253 | 0 |
| Leasing liabilitites | 3,797 | 2,955 |
| Total short-term interest-bearing debt | 307,050 | 147,973 |
| Total interest bearing debt | ||
| Total interest-bearing debt | 336,167 | 176,326 |
| Cash & cash equivalents | 243,713 | 397,819 |
| Net interest-bearing debt | 92,453 | -221,494 |
In June 2024 the Group expanded its existing senior secured debt financing package related to Indre Harøy Phase 1 and 2, from 1,550 NOKm to 2,225 NOKm. In June 2025 the Group entered credit facility of up to 250 NOKm with DNB and Nordea Bank to strengthen the Company’s financial flexibility. This facility was amended during the quarter, and the entire facility is available to support operations at Indre Harøy and ongoing phase 2 investments. Simultaneously in in June, the Company also increased its overdraft facility in connection with the Indre Harøy operation from 150 NOKm to 200 NOKm.
As per 31 December 2025, 1,527 NOKm was drawn of the secured green debt financing package. In addition, the Group has drawn 198 NOKm, of the 200 NOKm available under the Overdraft Facility. The Group has also entered into loan agreements for a total of NOK 60 million relating to Salmon Evolution Dale AS of which around NOK 49 million was drawn as per 31 December 2025. This loan is for financing of working capital, investments in Salmon Evolution Dale as well as refinancing of the seller’s credit from the acquisition of Salmon Evolution Dale AS. For 2025 the above table does not include other long-term liabilities of NOK 3.6 million related to water rights in Salmon Evolution Dale AS. The loans are floating interest rate loans denominated in NOK with an interest charge based on NIBOR 3M plus an agreed margin.
Financial covenants
The most important financial covenants for the long-term financing of the Group are, respectively, a solvency requirement that the borrower’s (Salmon Evolution Norway AS) book equity ratio (including intra-group loans) shall be minimum 45%. Further, there is a profitability requirement linked to the borrower’s EBITDA which shall be greater than NOK 250 million on a last 12-month basis from Q2 2027. Quarterly EBITDA figures shall be measured from Q2 2024 with set minimum EBITDA levels reflecting the company’s gradual ramp up of production volumes and profitability.
Finally, there is a minimum cash requirement that stipulates that the obligors (Salmon Evolution Norway AS, Salmon Evolution Sales AS and Salmon Evolution ASA) cash balance shall be greater than NOK 100 million at any time. Any undrawn and available amounts under the revolving facility and the overdraft is included in the calculation of the cash balance.
Reflecting the softer than expected salmon market over the last 12 months, the Company has agreed with its lenders to amend the EBITDA covenant requirements through 2025.
Security
The Company’s bank debt facilities are fully guaranteed by Salmon Evolution ASA. The respective lenders also have a pledge over 100% of the shares in Salmon Evolution Norway AS and Salmon Evolution Dale AS. Furthermore, the respective lenders have a pledge over all material operating assets of the Group, hereunder inter alia, land, plant and machinery, operating licenses, inventory and receivables.
Note 10 Taxes
Calculation of deferred tax/deferred tax benefit
| (NOK thousands) | 2025 | 2024 |
|---|---|---|
| Fixed assets | -654 | -483 |
| Right-of-use assets | 7,520 | 5,949 |
| Lease liabilities | -7,914 | -6,307 |
| Other temporary differences | -16,638 | -12,156 |
| Net temporary differences | -17,686 | -12,997 |
| Tax losses carried forward | 0 | 4,690 |
| Basis for deferred tax asset | 17,686 | 17,687 |
| Deferred tax asset (22%) | 3,891 | 3,891 |
| Deferred tax asset in the balance sheet | 3,891 | 3,891 |
Below, a tax payable has been calculated for Salmon Evolution ASA. The tax payable has been classified as deferred tax in the balance sheet, as it will be netted through a group contribution in 2026.
Basis for income tax expense, changes in deferred tax and tax payable
| (NOK thousands) | 2025 | 2024 |
|---|---|---|
| Result before taxes | 73,131 | 71,446 |
| Permanent differences* | 1,888 | -16,096 |
| Basis for the tax expense | 75,019 | 55,350 |
| Change in temporary differences | 4,690 | 510 |
| Application of loss carry forwards | -4,690 | -55,861 |
| Group contribution to subsidiary | 0 | 0 |
| Basis for payable taxes in the income statement | 75,019 | 0 |
The company does not have any temporary differences given rise to deferred tax/ deferred tax benefit.
Components of the tax expense
| (NOK thousands) | 2025 | 2024 |
|---|---|---|
| Payable tax on this year's result | 16,504 | 0 |
| Change in deferred tax | 0 | 5,224 |
| Change in deferred tax due to previous year group contribution | 0 | -415 |
| Change in deferred tax not capitalized in the balance sheet | 0 | -4,810 |
| Calculated tax expense | 16,504 | 0 |
Reconciliation of the tax expense with the nominal tax rate
| Reconciliation of the tax expense with the nominal tax rate | ||
|---|---|---|
| (NOK thousands) | 2025 | 2024 |
| Result before taxes | 73,131 | 71,446 |
| Calculated tax (22%) | 16,089 | 15,718 |
| Tax expense | 15,518 | 0 |
| Difference | -571 | -15,718 |
| The difference consists of: | ||
|---|---|---|
| Tax on permanent differences | -571 | -3,541 |
| Change in tax rate | 0 | 0 |
| Change in deferred tax due to change in tax rate | 0 | 0 |
| Change in deferred tax not shown in the balance sheet | 0 | -4,810 |
| Change due to application of loss carry forwards | 0 | -7,367 |
| Change due to group contribution from previous year (tax wise) | 0 | 0 |
| Sum explained differences | -571 | -15,718 |
Note 11 Investments in subsidiaries
| (NOK thousands) | Location and place of business | Ownership/ voting right | Equity 31.12.25 (100%) | Result 2025 (100%) | Balance sheet value |
|---|---|---|---|---|---|
| Salmon Evolution Norway AS | Hustadvika, Norway | 100 % | 256,416 | -241,658 | 781,500 |
| Salmon Evolution International AS | Hustadvika, Norway | 100 % | -28,084 | -4,769 | 1,000 |
| Salmon Evolution Dale AS | Folkestad, Norway | 100 % | 27,168 | 7,696 | 76,143 |
| Salmon Evolution Sales AS | Ålesund, Norway | 100 % | 1,723 | 0 | 1,000 |
| Salmon Evolution Technology AS | Hustadvika, Norway | 100 % | 20 | -4 | 51 |
| Balance sheet value as of 31 December 2025 | 859,694 | ||||
| *K Smart Farming Co., Ltd is owned through Salmon Evolution International AS | |||||
Investments in subsidiaries are valued at cost in the company accounts. The investment is valued as cost of acquiring shares, providing they are not impaired. An impairment loss is recognised for the amount by which the carrying amount of the subsidiary exceeds its recoverable amount. The recoverable amount is the higher of fair value less cost to sell and value in use. The recoverable amount of an investment in a subsidiary would normally be based on the present value of the subsidiary’s future cash flow. As of 31.12.2025 no impairment indicators were assessed to be present for the Company`s investments.
Movement in investment in subsidiaries during 2025 is analysed in the following way:
| (NOK thousands) | |
|---|---|
| Opening balance 01 January 2025 | 859,438 |
| Share options issued (Salmon Evolution Norway) | 168 |
| Share options issued (Salmon Evolution Dale) | 37 |
| Incorporation costs (Salmon Evolution Technology AS) | 51 |
| Closing balance 31 December 2025 | 859,695 |
Note 12 Cash and restricted cash
| (NOK thousands) | 31 Dec 2025 | 31 Dec 2024 |
|---|---|---|
| Cash in bank | 241,755 | 395,911 |
| Restricted bank deposits | 1,959 | 1,908 |
| Total cash and cash equivalents | 243,713 | 397,819 |
Restricted bank deposits are related to tax withholdings for employees (NOK 1.9 million).
Note 13 Share capital
| Nominal value | 31 Dec 2025 | 31 Dec 2024 | |
|---|---|---|---|
| Ordinary shares | 0.05 | 462,603,306 | 462,603,306 |
| Average number of shares | 0.05 | 462,603,306 | 440,297,748 |
| (NOK thousands) | 31 Dec 2025 | 31 Dec 2024 | |
| Share capital | 23,130 | 23,130 | |
| Share premium | 2,450,459 | 2,450,459 | |
| Total | 2,473,589 | 2,473,589 |
The number of shares issued in the company at 31 December 2025 was 462,603,306 with a nominal value of NOK 0.05 each. All shares carry equal voting rights.
| 20 largest shareholders as of 31.12.25 | No of shares | Percentage share |
|---|---|---|
| DNB Asset Management | 33,213,268 | 7.2 % |
| Ronja Capital Investment AS | 32,457,311 | 7.0 % |
| Farvatn AS | 30,696,975 | 6.6 % |
| Handelsbanken Fonder | 23,465,547 | 5.1 % |
| Dongwon Industries | 17,932,838 | 3.9 % |
| Rofisk AS | 15,204,563 | 3.3 % |
| Nordea Funds | 15,132,358 | 3.3 % |
| Kjølås Stansekniver AS | 13,173,105 | 2.8 % |
| Stette Invest AS | 12,410,954 | 2.7 % |
| Jakob Hatteland Holding AS | 10,907,805 | 2.4 % |
| Ewos AS | 9,480,984 | 2.0 % |
| Mevold Invest AS | 9,074,474 | 2.0 % |
| Lyngheim Invest AS | 8,149,252 | 1.8 % |
| Hustadlitt AS | 7,500,000 | 1.6 % |
| Bortebakken AS | 7,267,330 | 1.6 % |
| Jan Heggelund | 6,096,085 | 1.3 % |
| Bondø Invest AS | 4,614,718 | 1.0 % |
| Nordnet Livsforsikring AS | 3,403,268 | 0.7 % |
| Fosna Forvaltning AS | 3,350,000 | 0.7 % |
| AS Straen | 3,300,000 | 0.7 % |
| Total 20 largest shareholders | 266,830,835 | 57.7 % |
| Other shareholders | 195,772,471 | 42.3 % |
| Total number of shares | 462,603,306 | 100.0 % |
As of 31 December 2025, shares directly held by members of the Board of Directors, Chief Executive officer, and Executive Management consisted of the following:
| No of shares | Percentage share | |
|---|---|---|
| Peder Stette, Member of the board - Stette Invest AS | 12,410,954 | 2.7 % |
| Vibecke Bondø, Member of the board - Bondø Invest AS | 4,614,718 | 1.0 % |
| Ingjarl Skarvøy, COO - Terra Mare AS and private | 1,800,150 | 0.4 % |
| Trond Håkon Schaug-Pettersen, CEO - Troha Invest AS | 500,000 | 0.1 % |
| Odd Frode Roaldsnes, CCO - Anno Invest AS | 275,000 | 0.1 % |
| Jan-Emil Johannessen, Member of the board - Jawendel AS | 173,333 | 0.0 % |
| Anne Breiby, Member of the board | 168,935 | 0.0 % |
| Kamilla Mordal Holo, Project Director - C10 Holding AS & private | 160,060 | 0.0 % |
| Trond Vadset Veibust, CFO - Trollkyrkja AS | 90,000 | 0.0 % |
| Vidar Skjørli, Director HR & Strategy | 6,216 | 0.0 % |
| Total | 20,199,366 | 4.4 % |
Capital history
| (NOK thousands) | Date | Capital Increase | Share Capital After Change | Par Value | Subscription price per share | New shares | Total no. of outstanding shares |
|---|---|---|---|---|---|---|---|
| Opening balance 1 July 2020 | 5,375,159 | 0.05 | 107,503,182 | ||||
| Share options exercised | 10 July 2020 | 30,000 | 5,405,159 | 0.05 | 3.33 | 600,000 | 108,103,182 |
| Private placement | 23 July 2020 | 581,395 | 5,986,554 | 0.05 | 4.30 | 11,627,906 | 119,731,088 |
| Private placement | 11 September 2020 | 5,000,000 | 10,986,554 | 0.05 | 5.00 | 100,000,000 | 219,731,088 |
| Private placement | 23 March 2021 | 4,166,667 | 15,153,221 | 0.05 | 6.00 | 83,333,333 | 303,064,421 |
| Acquisition Kraft Laks | 16 August 2021 | 109,535 | 15,262,756 | 0.05 | 7.58 | 2,190,694 | 305,255,115 |
| Private placement | 12 October 2021 | 277,068 | 15,539,824 | 0.05 | 7.71 | 5,541,374 | 310,796,489 |
| Share options exercised | 26 March 2022 | 81,250 | 15,621,074 | 0.05 | 4.80 | 1,625,000 | 312,421,489 |
| Private placement | 5 April 2022 | 1,666,667 | 17,287,741 | 0.05 | 9.00 | 33,333,333 | 345,754,822 |
| Private placement | 18 April 2023 | 3,409,091 | 20,696,832 | 0.05 | 7.70 | 68,181,818 | 413,936,640 |
| Private placement | 18 June 2024 | 2,433,333 | 23,130,165 | 0.05 | 7.50 | 48,666,666 | 462,603,306 |
The Company entered into an investment agreement with Dongwon Industries and completed a NOK 50 million private placement towards Dongwon Industries in July 2020.
The Company raised NOK 500 million in a private placement in connection with its initial public offering related to the admission on Merkur Market (now Oslo Børs) in September 2020. Further, the Company also raised another NOK 500 million in a private placement in March 2021.
In August 2021 the Company acquired 100% of the shares in Kraft Laks AS (now Salmon Evolution Dale AS). As part of the settlement the Company issued 2,190,694 new shares of NOK 7.5775 per share, and thereby increased its equity by NOK 16.6 million. In October 2021 the Company carried out a private placement of USD 5m (NOK ~43m) towards Cargill.
Further, in April 2022 the Company carried out a private placement raising gross proceeds of NOK 300 million at a subscription price of NOK 9.00 per share, bringing total raised equity to more than NOK 1.7 billion.
In April 2023 the Company carried out a private placement raising gross proceeds of NOK 525 million at a subscription price of NOK 7.7 per share, bringing total raised equity to more than NOK 2.2 billion.
In June 2024 the Company carried out a private placement raising gross proceed of NOK 365 million at a subscription price of NOK 7.5 per share, bringing total raised equity to more than NOK 2.5 billion.
Note 14 Trade and other current liabilities
| (NOK thousands) | 31 Dec 2025 | 31 Dec 2024 |
|---|---|---|
| Trade payables | 3,626 | 2,041 |
| Total trade payables | 3,626 | 2,041 |
| (NOK thousands) | 31 Dec 2025 | 31 Dec 2024 |
|---|---|---|
| Payroll withholding tax, VAT and other taxes | 1,969 | 1,911 |
| Employer's national insurance contributions | 1,554 | 1,790 |
| Accrued salaries, holiday pay and bonus provisions | 10,074 | 6,942 |
| Total other current liabilities | 13,598 | 10,643 |
Note 15 Events after the reporting date
No material subsequent events.
Directors’ responsibility statement
Today, the Board of Directors and the Chief Executive Officer reviewed and approved the Board of Director’s report and the consolidated and separate annual financial statements for Salmon Evolution ASA for the fiscal year ended December 31, 2025 (Annual report 2025).
Salmon Evolution ASA’s consolidated financial statements have been prepared in accordance with IFRSs and IFRICs as adopted by the EU and applicable additional disclosure requirements in the Norwegian Accounting act. The separate financial statements for Salmon Evolution ASA have been prepared in accordance with the Norwegian Accounting Act § 3-9 and Finance Ministry’s prescribed regulations from 21 January 2008 on simplified IFRS. The Board of Directors’ report for the Group and the parent company is in accordance with the requirements in the Norwegian Accounting Act and Norwegian accounting standard no 16, as of December 31, 2025.
To the best of our knowledge:
- The annual financial statements for 2025 have been prepared in accordance with applicable financial reporting standards
- The consolidated and separate annual financial statements give a true and fair view of the assets, liabilities, financial position and profit as of 31 December 2025 for the Group and the parent company.
- The Board of Directors’ report for the Group includes a fair review of:
- the development and performance of the business and the position of the Group, and the parent company
- the principal risks and uncertainties the Group and parent company face.
The Board of Directors of Salmon Evolution ASA
Elnesvågen/Ålesund 27 April 2026
Tore Tønseth
Chair
Peder Stette
Director
Anne Breiby
Director
Ingvild Vartdal
Director
Vibecke Bondø
Director
Jan-Emil Johannessen
Director
Eunhong Min
Director
Trond Håkon Schaug-Pettersen
CEO
Independent auditor’s report
Alternative Performance Measures
| APM | Definition & calculation | Reason for applying APM |
|---|---|---|
| Operational EBIT | Operational EBIT is calculated by adding the fair value adjustment of biomass to financial statement line-item Operating Profit (EBIT). For further information on revenues, other income, cost of materials, change in inventory, personnel expenses and other operating expenses see notes 4, 7, 8, 10. | Operational EBIT are used by management, analysts, investors and is a well-known industry-measure to assess our performance. In addition, excluding fair value assessments that are linked to assumptions about the future from our EBIT gives a better comparability of our operational performance. |
| Operational EBITDA | Operational EBITDA is operational EBIT plus depreciations, write-downs and amortization. Operational EBITDA is reported in the Group’s segment reporting (see Note 5). For further information in revenues, other income, cost of materials, change in inventory, personnel expenses and other operating expenses see notes 4, 7, 8, 10. | Operational EBITDA are used by management, analysts, investors and is a well-known industry-measure to assess our performance. In addition, excluding fair value assessments that are linked to assumptions about the future, and depreciations, write-downs and amortization, from our EBIT gives a better comparability of our operational performance. |
| Farming EBITDA cost/kg | Farming EBITDA cost per kg is the sum of all direct production and harvest cost and other operating expenses (G&A), divided by harvest volume. Capacity adjustments, incident-based mortality, culling and export cost excluded. For further information see notes 5, 6, and 7. The metric is reported as a key figure of the Group. | Farming EBITDA cost are used by management, analysts, investors and is a well-known industry-measure to assess our performance. In addition, excluding fair value assessments that are linked to assumptions about the future, and depreciations, write-downs and amortization, from our EBIT gives a better comparability of our operational performance. |
| NIBD | Net interest-bearing debt (NIBD) comprises interest-bearing loans and borrowings and lease liabilities, after deducting cash and cash equivalents. The metric is reported as a key figure of the Group and also reported in Note 22 in the annual report. | Net interest-bearing liabilities is a measure of the Group’s net debt and borrowing commitments and is useful to assess the financial robustness and flexibility of the capital structure of the Group. |
| Equity ratio | Equity ratio is calculated according to the Statement of Financial Position divided by total equity and liabilities according to the Statement of Financial Position. The metric is reported as a key figure of the Group. | Equity ratio captures the financial solidity of the Group. Equity-ratio is, together with NIBD, useful to assess the financial robustness and -flexibility of the capital structure of the Group. |
Reconciliations
| Operational EBIT (NOK thousands) | 2025 | 2024 |
|---|---|---|
| Operational EBIT | -158 906 | -4 727 |
| Fair value adjustments: | ||
| Change in fair value of the biological assets | 15 630 | -10 498 |
| Operating profit/loss | -143 276 | -15 225 |
| Operational EBITDA (NOK thousands) | 2025 | 2024 |
|---|---|---|
| Operational EBIT | -158 906 | -4 727 |
| Depreciation | -80 221 | -76 142 |
| Operational EBITDA | -78 686 | 71 415 |
| Net interest bearing debt (NOK thousands) | 2025 | 2024 |
|---|---|---|
| Long-term debt to credit institutions | 1 545 228 | 569 100 |
| Short-term debt to credit institutions | 334 571 | 158 488 |
| Cash & cash equivalents | 163 438 | 429 462 |
| Net interest-bearing debt (NIBD) | 1 757 437 | 298 126 |
| Lease liabilities | 41 075 | 14 986 |
| NIBD incl. Lease liabilities | 1 798 512 | 313 111 |
| Equity ratio (NOK thousands) | 2025 | 2024 |
|---|---|---|
| Total equity | 2 062 673 | 2 223 260 |
| Total liabilities | 2 152 934 | 961 088 |
| Equity ratio | 49 % | 70 % |
Sustainability Indicators and GRI Index
Being transparent in our reporting and operation have been important factors for us from the start. Therefore, we have chosen to report on our environmental, social, and governance factors in 2025.
| GRI DISCLOSURE | LOCATION |
|---|---|
| GRI 2: General Disclosures 2021 | |
| 2-1 Organizational details | pp. 3-4, 6-8 |
| 2-2 Entities included in the organization’s sustainability reporting | Salmon Evolution ASA with subsidiaries, p. 58 |
| 2-3 Reporting period, frequency and contact point | 01.01.2025-31.12.2025 – Annual reports from 2025 – Contact point: CFO |
| 2-4 Restatements of information | pp. 10-11 |
| 2-5 External assurance | N/A – no external assurance of ESG reporting for the 2025 report |
| 2-6 Activities, value chain and other business relationships | pp. 3-4, 16-22, 27-28 |
| 2-7 Employees | pp. 23-26 |
| 2-8 Workers who are not employees | N/A – only employees or subcontractors |
| 2-9 Governance structure and composition | pp. 12, 43 |
| 2-10 Nomination and selection of the highest governance body | pp. 43-51 |
| 2-11 Chair of the highest governance body | p. 48 |
| 2-12 Role of the highest governance body in overseeing the management of impacts | p. 48 |
| 2-13 Delegation of responsibility for managing impacts | pp. 11, 14, 27-29 |
| 2-15 Conflicts of interest | pp. 27-28, 43-44 |
| 2-16 Communication of critical concerns | pp. 44-46 |
| 2-17 Collective knowledge of the highest governance body | pp. 41-42 |
| 2-19 Remuneration policies | pp. 49-50 |
| 2-20 Process to determine remuneration | pp. 49-50 |
| 2-22 Statement on sustainable development strategy | pp. 12-14 |
| 2-23 Policy commitments | pp. 14-15 |
| 2-24 Embedding policy commitments | pp. 14-15 |
| 2-27 Compliance with laws and regulations | pp. 43-44 |
| 2-28 Membership associations | pp. 46-47 |
| 2-29 Approach to stakeholder engagement | pp. 27-29 |
| 2-30 Collective bargaining agreements | pp. 24-25 |
| GRI DISCLOSURE | LOCATION |
| GRI 3: Material Topics | |
| 3-1 Process to determine material topics | p. 11 |
| 3-2 List of material topics | p. 11 |
| 3-3 Management of material topics | p. 11 |
| GRI 201: Economic Performance | |
| 201-1 Direct economic value generated and distributed | See financial statements and notes pp. 52-110 |
| 201-2 Financial implications and other risks and opportunities due to climate change | pp. 16-18 |
| 201-3 Defined benefit plan obligations and other retirement plans | See financial statements and notes pp. 52-110 |
| 201-4 Financial assistance received from government | See financial statements and notes pp. 52-110 |
| GRI 205: Anti-corruption | |
| 205-2 Communication and training about anti-corruption policies and procedures | pp. 12, 39 |
| 205-3 Confirmed incidents of corruption and actions taken | Zero (0) incidents |
| GRI 301: Materials | |
| 301-1 Materials used by weight or volume | p. 22 |
| 301-2 Recycled input materials used | pp. 14-18 |
| GRI 302: Energy | |
| 302-1 Energy consumption within the organization | p. 16 |
| 302-2 Energy consumption outside of the organization | p. 16 |
| GRI 303: Water and Effluents | |
| 303-1 Interactions with water as a shared resource | pp. 14-22 |
| 303-2 Management of water discharge-related impacts | pp. 14-22 |
| 303-3 Water withdrawal | pp. 14-22 |
| 303-4 Water discharge | pp. 14-22 |
| 303-5 Water consumption | pp. 14-22 |
| GRI 304: Biodiversity | |
| 304-2 Significant impacts of activities, products and services on biodiversity | pp. 16-18 |
| GRI 305: Emissions | |
| 305-1 Direct (Scope 1) GHG emissions | p. 22 |
| 305-2 Energy indirect (Scope 2) GHG emissions | p. 16 – 100% renewable energy |
| 305-5 Reduction of GHG emissions | p. 22 |
| GRI DISCLOSURE | LOCATION |
|---|---|
| GRI 306: Waste | |
| 306-1 Waste generation and significant waste-related impacts | pp. 16-18 |
| GRI 401: Employment | |
| 401-1 New employee hires and employee turnover | 9 new employees, 2% turnover |
| 401-3 Parental leave | p. 24 |
| GRI 403: Occupational Health and Safety | |
| 403-1 Occupational health and safety management system | pp. 24-26 |
| 403-2 Hazard identification, risk assessment, and incident investigation | pp. 24-26 |
| 403-3 Occupational health services | pp. 24-26 |
| 403-4 Worker participation, consultation, and communication on occupational health and safety | pp. 24-26 |
| 403-5 Worker training on occupational health and safety | Health and safety training for all employees |
| 403-6 Promotion of worker health | pp. 24-26 |
| 403-9 Work-related injuries | pp. 24-26 |
| 403-10 Work-related ill health | Zero (0) incidents |
| GRI 404: Training and Education | |
| 404-1 Average hours of training per year per employee | pp. 24-25 |
| 404-2 Programs for upgrading employee skills and transition assistance programs | pp. 24-25 |
| 404-3 Percentage of employees receiving regular performance and career development reviews | pp. 24-25 |
| GRI 405: Diversity and Equal Opportunity | |
| 405-1 Diversity of governance bodies and employees | pp. 9, 26, 39-40, 41-42(BoD) |
| 405-2 Ratio of basic salary and remuneration of women to men | p. 40 |
| GRI 406: Non-discrimination | |
| 406-1 Incidents of discrimination and corrective actions taken | Zero (0) incidents reported |
| GRI 413: Local Communities | |
| 413-1 Operations with local community engagement, impact assessments, and development programs | pp. 27-28 |
ABOUT SALMON EVOLUTION
Salmon Evolution is the global leader within land-based salmon farming with a clear roadmap for 100,000 tonnes HOG annual production capacity. Pioneering the hybrid flow-through system (HFS), Salmon Evolution is Extending the Ocean Potential by creating optimal growth conditions in a controlled environment on land. This approach, capturing the benefits of both land-based and sea-based farming, puts biology first and limits operational and biological risk.
Salmon Evolution is strategically located the heart of the global aquaculture industry on the west coast of Norway, where the Company has its first facility and global centre of excellence fully operational at industrial scale. Enabled by the proof of concept in Norway, Salmon Evolution targets significant international expansion.
Salmon Evolution is listed on Oslo Børs under the ticker SALME. To learn more, please visit www.salmonevolution.no.
OFFICE ADDRESS
Torget 5, 6440 Elnesvågen, Norway
PRODUCTION SITE
Indre Harøyvegen 88, 6430 Bud, Norway
BUSINESS REGISTRATION NUMBER
NO 925 344 877 MVA
E-mail: post@salmone.no
Web: salmonevolution.no